Question: I Created data visuals to depict the relationship between the following among ED visits.explain in a few sentences what the map represents. 1.Opioid prescription (OPIOID
I Created data visuals to depict the relationship between the following among ED visits.explain in a few sentences what the map represents.
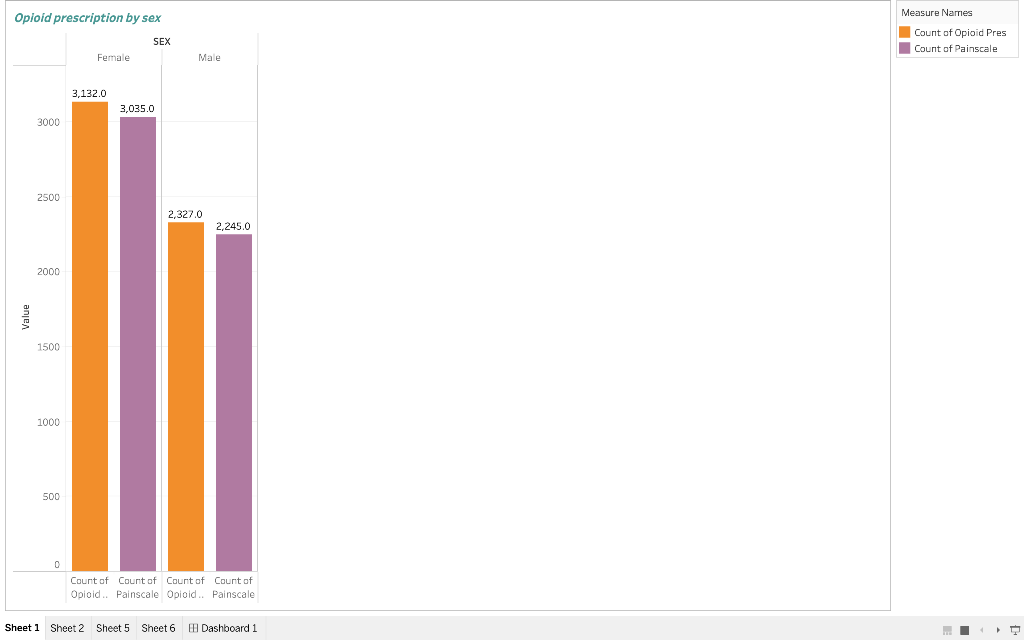
1.Opioid prescription (OPIOID PRES) and Gender (SEX)/Pain scale (PAINSCALE)
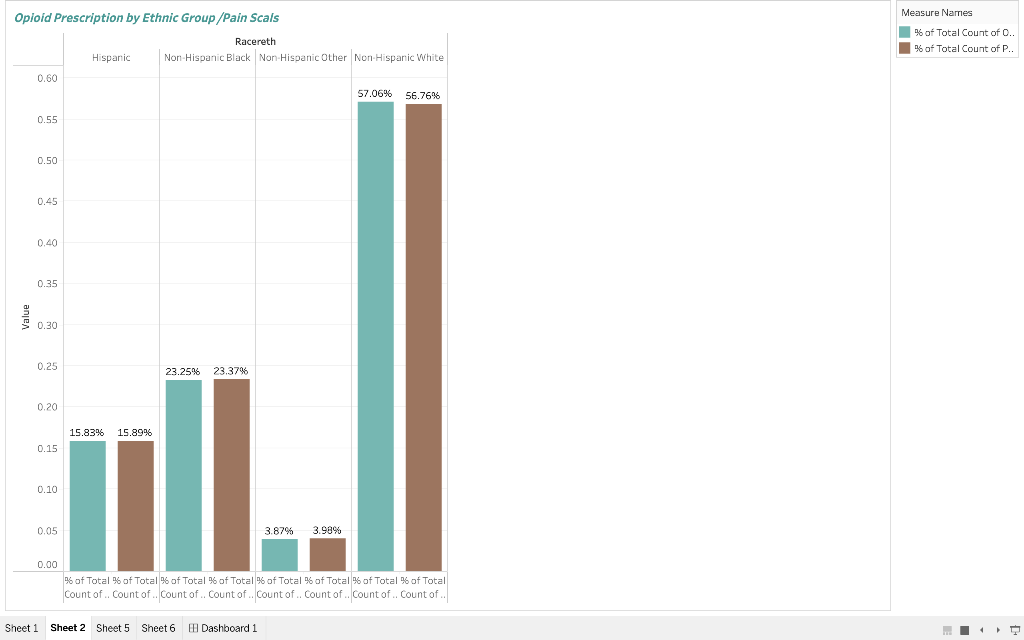
2.Opioid prescription (OPIOID PRES) and Ethnic group (RACERETH)/Pain (PAINSCALE)
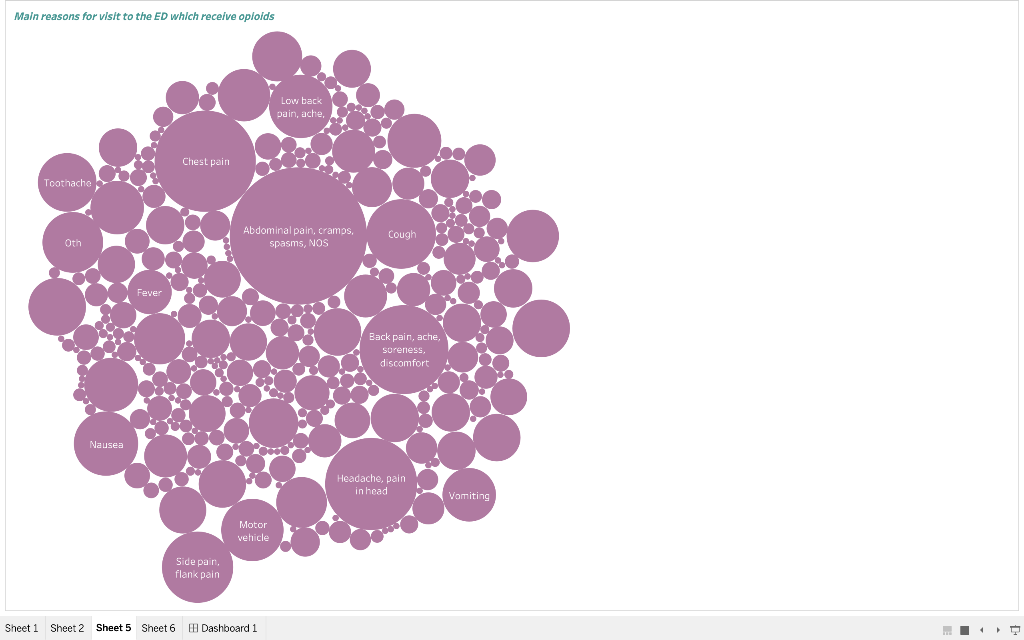
3.Opioid prescription (OPIOID PRES) and the type of visit (RFV1)
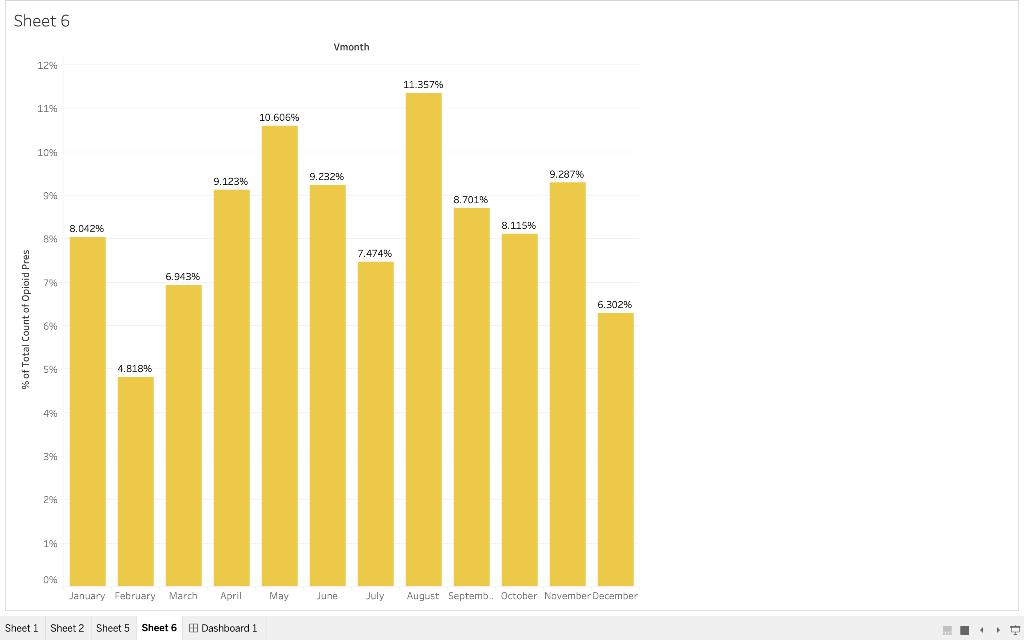
- Opioid prescription (OPIOID PRES) and months
Opioid prescription by sex SEX Female Measure Names Count of Opioid Pres Count of Painscale Male 3,132.0 3,035.0 3000 2500 2,327,0 2,245.0 2000 1500 1000 500 Count of Count of Count of Count of Opioid.. Painscale Opioid.. Painscale Sheet 1 Sheet 2 Sheet 5 Sheet 6 Hi Dashboard 1 Measure Names Opioid Prescription by Ethnic Group/Pain Scals Racereth Hispanic Non-Hispanic Black Non-Hispanic Other Non-Hispanic White 0.60 57.06% 56.76% % of Total Count of O. % of Total Count of P.. 0.55 0.50 0.45 0.40 0.35 10.30 0.25 23.25% 23.37% 0.20 15.83% 15.89% 0.15 0.10 0.05 3.87% 3.98% 0.00 % of Total % of Total % of Total% of Total % of Total % of Total% of Total % of Total Count of Count of .. Count of Count of .. Count of Count of .. Count of Count of Sheet 1 Sheet 2 Sheet 5 Sheet 6 Dashboard 1 . Main reasons for visit to the ED which receive oploids Low back pain, ache, Chest pain Toothache Abdominal pain, cramps, spasms, NOS Cough Oth Fever Back pain, ache. soreness, discomfort Nausea Headache, pain in head Vomiting Motor vehicle Side pain, flank pain Sheet 1 Sheet 2 Sheet 5 Sheet 6 II Dashboard 1 Sheet 6 Vmonth 12% 11.35796 11% 10.60595 10% 9.123% 9.287% 9.23296 99 8.701% 8.042% 8.1159 8% 7.474% 6.943% 794 6.302% % of Total Count of Opioid Pres 69% 594 4.818% 494 391 2% 1% 0% January February March April May June July August Septemb.. October November December Sheet 1 Sheet 2 Sheet 5 Sheet 6 Dashboard 1 Opioid prescription by sex SEX Female Measure Names Count of Opioid Pres Count of Painscale Male 3,132.0 3,035.0 3000 2500 2,327,0 2,245.0 2000 1500 1000 500 Count of Count of Count of Count of Opioid.. Painscale Opioid.. Painscale Sheet 1 Sheet 2 Sheet 5 Sheet 6 Hi Dashboard 1 Measure Names Opioid Prescription by Ethnic Group/Pain Scals Racereth Hispanic Non-Hispanic Black Non-Hispanic Other Non-Hispanic White 0.60 57.06% 56.76% % of Total Count of O. % of Total Count of P.. 0.55 0.50 0.45 0.40 0.35 10.30 0.25 23.25% 23.37% 0.20 15.83% 15.89% 0.15 0.10 0.05 3.87% 3.98% 0.00 % of Total % of Total % of Total% of Total % of Total % of Total% of Total % of Total Count of Count of .. Count of Count of .. Count of Count of .. Count of Count of Sheet 1 Sheet 2 Sheet 5 Sheet 6 Dashboard 1 . Main reasons for visit to the ED which receive oploids Low back pain, ache, Chest pain Toothache Abdominal pain, cramps, spasms, NOS Cough Oth Fever Back pain, ache. soreness, discomfort Nausea Headache, pain in head Vomiting Motor vehicle Side pain, flank pain Sheet 1 Sheet 2 Sheet 5 Sheet 6 II Dashboard 1 Sheet 6 Vmonth 12% 11.35796 11% 10.60595 10% 9.123% 9.287% 9.23296 99 8.701% 8.042% 8.1159 8% 7.474% 6.943% 794 6.302% % of Total Count of Opioid Pres 69% 594 4.818% 494 391 2% 1% 0% January February March April May June July August Septemb.. October November December Sheet 1 Sheet 2 Sheet 5 Sheet 6 Dashboard 1


