

Question: I created the following tables from an assignment data in SPSS: fCorrelations Weight price Weight Pearson Correlation .945 Sig. (2-tailed)
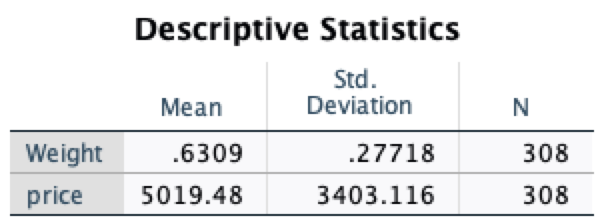
I created the following tables from an assignment data in SPSS:
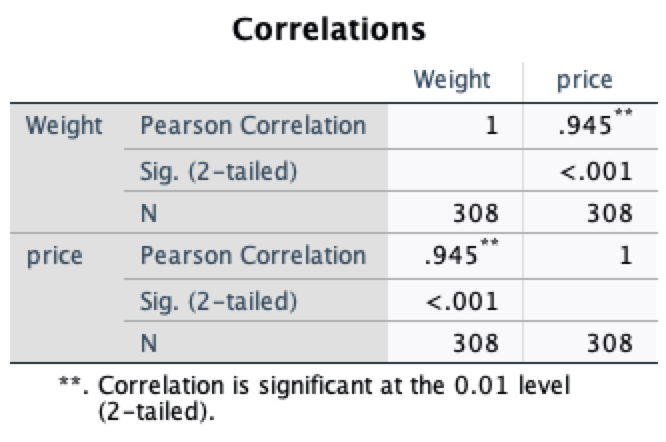
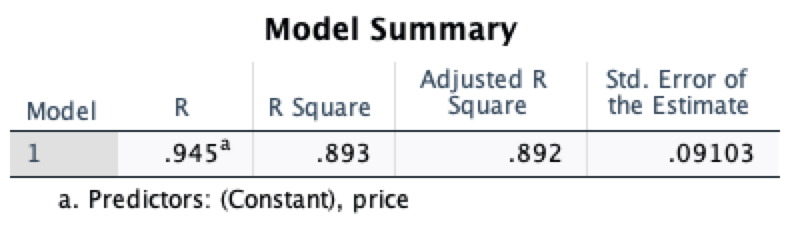
\fCorrelations Weight price Weight Pearson Correlation .945 Sig. (2-tailed) <.001 n price pearson correlation .945 sig. is significant at the level summary adjusted r std. error of model square estimate .893 .892 .09103 a. predictors:>
Step by Step Solution
There are 3 Steps involved in it
1 Expert Approved Answer
Step: 1 Unlock

Question Has Been Solved by an Expert!
Get step-by-step solutions from verified subject matter experts
Step: 2 Unlock
Step: 3 Unlock