

Question: Need typed answer. Please draw the graph by excl. 61. Previously, De Anza statistics students estimated that the amount of change daytime statistics students carry
Need typed answer. Please draw the graph by excl.
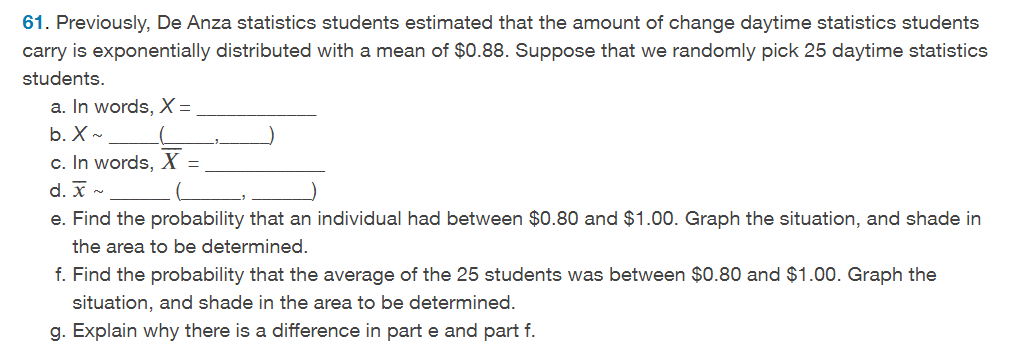
61. Previously, De Anza statistics students estimated that the amount of change daytime statistics students carry is exponentially distributed with a mean of $0.88. Suppose that we randomly pick 25 daytime statistics students. a. In words, X : b. X ~ [_,_) c. In words, f : d. E ~ { , l e. Find the probability that an individual had between $0.80 and $1.00. Graph the situation, and shade in the area to be determined. f. Find the probability that the average of the 25 students was between $0.80 and $1.00. Graph the situation, and shade in the area to be determined. 9. Explain why there is a difference in part e and part f
Step by Step Solution
There are 3 Steps involved in it

Get step-by-step solutions from verified subject matter experts