

Question: I created this gantt chart in excel, how can I display this similar format of gantt in Microsoft power BI? Is it possible? If so,
I created this gantt chart in excel, how can I display this similar format of gantt in Microsoft power BI? Is it possible? If so, can someone please explain on how I can create this similar format in power BI? I know there is a gantt chart in Power BI, but I don't know how to get it to replicate this chart.
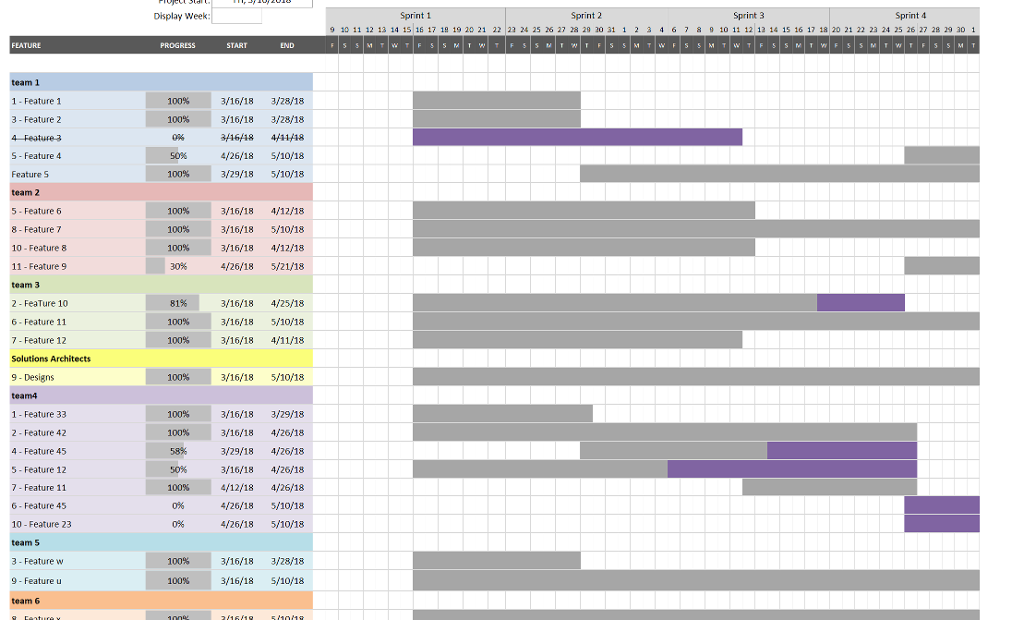
Display Week Sprint 1 Sprint 2 Sprint 3 Sprint 4 20 11 12 13 14 15 16171819 20 21 22 22 24 25 2627282920 31 1 2 3 4 6 7 ? g 10 11 12 12 14 15 16 17 1820 21 22 23 24 25 26 27 28 29 aol START team 1 1 Feature 1 3 - Feature 2 S- Feature 4 FeatureS team 2 7- Feature 12 Solutions Architects 1 - Feature 33 2- Feature 42 4- Feature 45 5 Feature 12 7- Feature 11 6- Feature 45 10 Feature 23 team 6
Step by Step Solution
There are 3 Steps involved in it

Get step-by-step solutions from verified subject matter experts