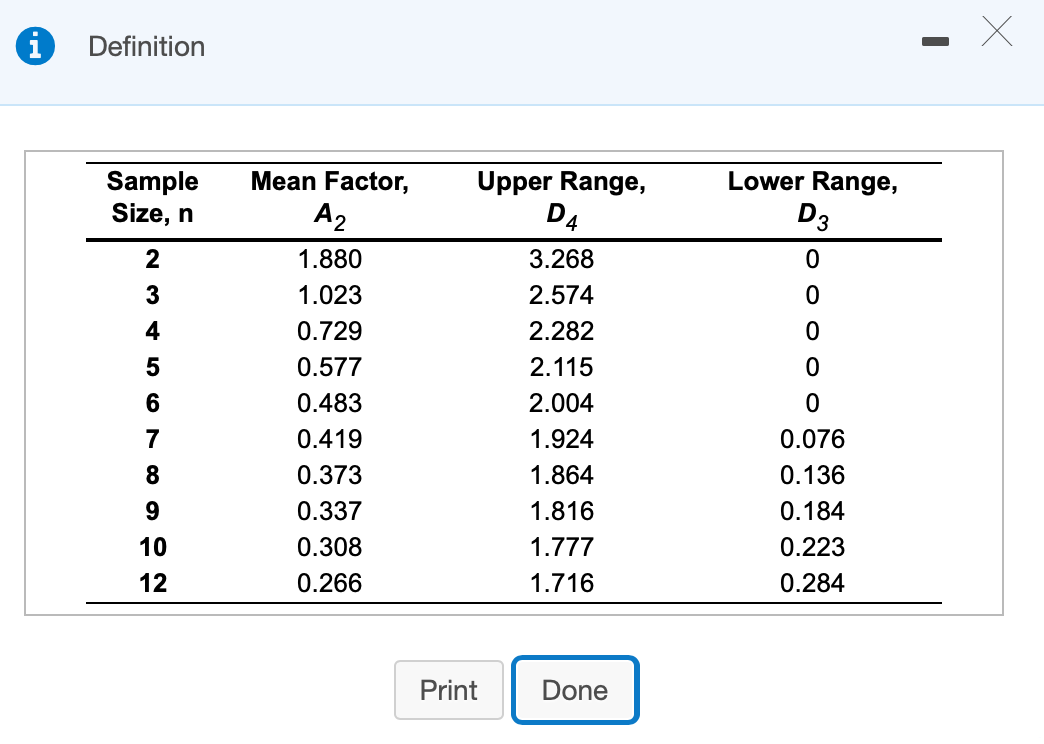
Question: i Definition - Lower Range, Sample Size, n D3 2 0 0 3 4 0 0 5 6 7 8 9 Mean Factor, A2 1.880

i Definition - Lower Range, Sample Size, n D3 2 0

i Definition - Lower Range, Sample Size, n D3 2 0

i Definition - Lower Range, Sample Size, n D3 2 0

i Definition - Lower Range, Sample Size, n D3 2 0 0 3 4 0 0 5 6 7 8 9 Mean Factor, A2 1.880 1.023 0.729 0.577 0.483 0.419 0.373 0.337 0.308 0.266 Upper Range, D4 3.268 2.574 2.282 2.115 2.004 1.924 1.864 1.816 1.777 1.716 0 0.076 0.136 0.184 0.223 0.284 10 12 Print Done Refer to Table 56.1 - Factors for Computing Control Chart Limits (3 sigma) for this problem. Auto pistons at Wemming Chung's plant in Shanghai are produced in a forging process, and the diameter is a critical factor that must be controlled. From sample sizes of 10 pistons produced each day, the mean and the range of this diameter have been as follows: Day 1 2 Mean x (mm) 154.9 155.2 155.6 157.5 156.6 Range R (mm) 4.4 4.6 4.1 5.0 4.5 3 4 5 a) What is the value of x? X= mm (round your response to two decimal places). b) What is the value of R? R= mm (round your response to two decimal places). c) What are the UCL; and LCL, using 3-sigma? Upper Control Limit (UCL2) = mm (round your response to two decimal places). Lower Control Limit (LCL;) = mm (round your response to two decimal places). d) What are the UCLR and LCLR using 3-sigma? Upper Control Limit (UCLR) = mm (round your response to two decimal places). Lower Control Limit (LCLR) = 0 mm (round your response to two decimal places)

Step by Step Solution

There are 3 Steps involved in it

1 Expert Approved Answer
Step: 1 Unlock blur-text-image
Question Has Been Solved by an Expert!

Get step-by-step solutions from verified subject matter experts

Step: 2 Unlock
Step: 3 Unlock

Students Have Also Explored These Related General Management Questions!