Question: STATISTICAL PROCESS CONTROL 3. Control limits for variable process control charts a. R-chart, range of sample: Upper control limit = UCLR = D.R Lower control
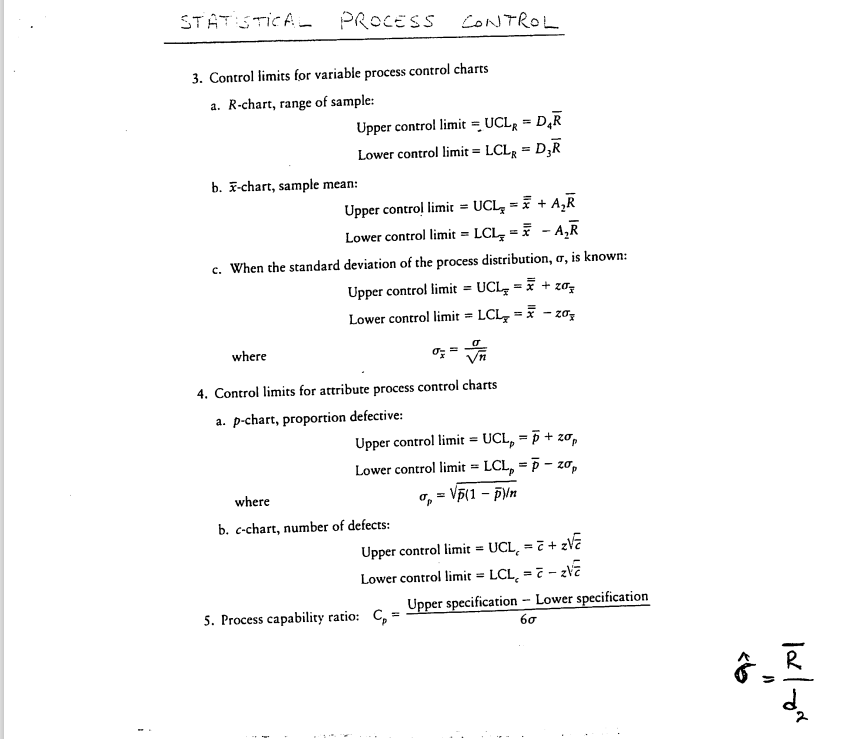
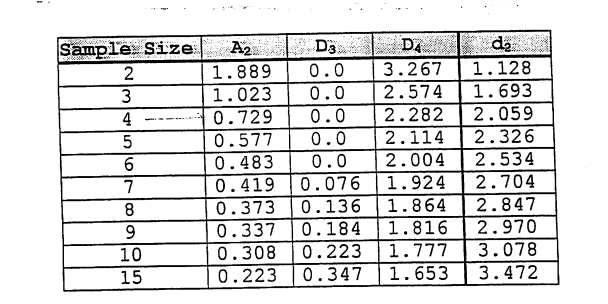
STATISTICAL PROCESS CONTROL 3. Control limits for variable process control charts a. R-chart, range of sample: Upper control limit = UCLR = D.R Lower control limit = LCLR = DER b. -chart, sample mean: Upper control limit = UCL = 1 + AR Lower controllimit = LCL = * - AR c. When the standard deviation of the process distribution, cr, is known: Upper control limit = UCL = + zoz Lower control limit = LCL - 204 where o Vn 4. Control limits for attribute process control charts a. p-chart, proportion defective: Upper control limit = UCL, Lower control limit = LCL, = 7 - zo where , = Vp(1 - pin b. c-chart, number of defects: Upper control limit = UCL, = +zVE Lower control limit = LCL = 7 - zla 5. Process capability ratio: C Upper specification - Lower specification = +20, + 60 R HR de Sample Size 2 3 4 5 6 7 8 9 10 15 A2 1.889 1.023 0.729 0.577 0.483 0.419 0.373 0.337 0.308 0.223 Da 0.0 0.0 0.0 0.0 0.0 0.076 0.136 0.184 0.223 0.347 D4 3.267 2.574 2.282 2.114 2.004 1.924 1.864 1.816 1.777 1.653 de 1.128 1.693 2.059 2.326 2.534 2.704 2.847 2.970 3.078 3.472 STATISTICAL PROCESS CONTROL 3. Control limits for variable process control charts a. R-chart, range of sample: Upper control limit = UCLR = D.R Lower control limit = LCLR = DER b. -chart, sample mean: Upper control limit = UCL = 1 + AR Lower controllimit = LCL = * - AR c. When the standard deviation of the process distribution, cr, is known: Upper control limit = UCL = + zoz Lower control limit = LCL - 204 where o Vn 4. Control limits for attribute process control charts a. p-chart, proportion defective: Upper control limit = UCL, Lower control limit = LCL, = 7 - zo where , = Vp(1 - pin b. c-chart, number of defects: Upper control limit = UCL, = +zVE Lower control limit = LCL = 7 - zla 5. Process capability ratio: C Upper specification - Lower specification = +20, + 60 R HR de Sample Size 2 3 4 5 6 7 8 9 10 15 A2 1.889 1.023 0.729 0.577 0.483 0.419 0.373 0.337 0.308 0.223 Da 0.0 0.0 0.0 0.0 0.0 0.076 0.136 0.184 0.223 0.347 D4 3.267 2.574 2.282 2.114 2.004 1.924 1.864 1.816 1.777 1.653 de 1.128 1.693 2.059 2.326 2.534 2.704 2.847 2.970 3.078 3.472


