

Question: I desperately need help here! See below: Please provide all formulas used for all cells. Case 7.1. Tires for You, Inc. Tires for You, Inc.
I desperately need help here! See below:
Please provide all formulas used for all cells.
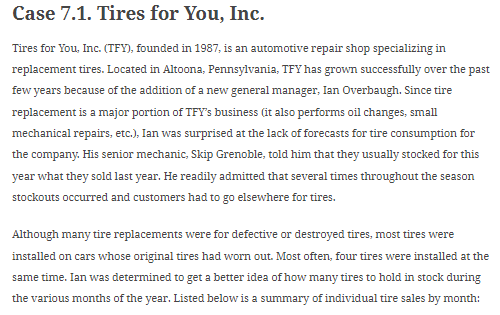
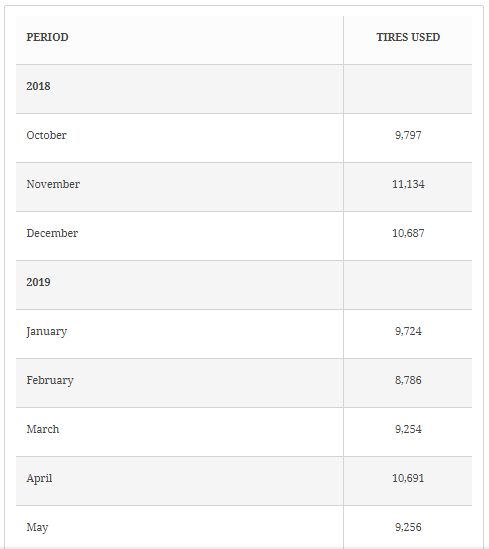
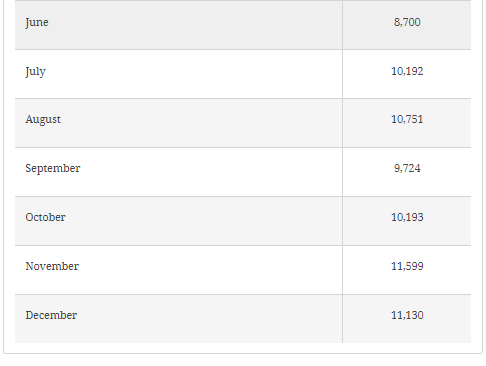
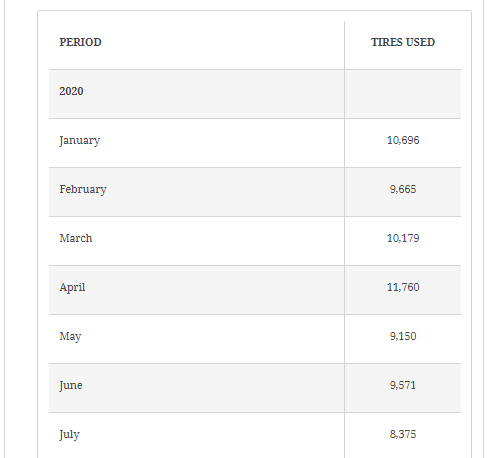
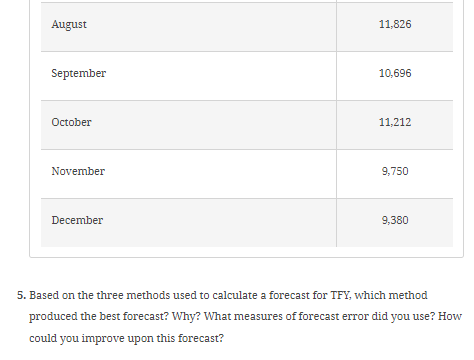
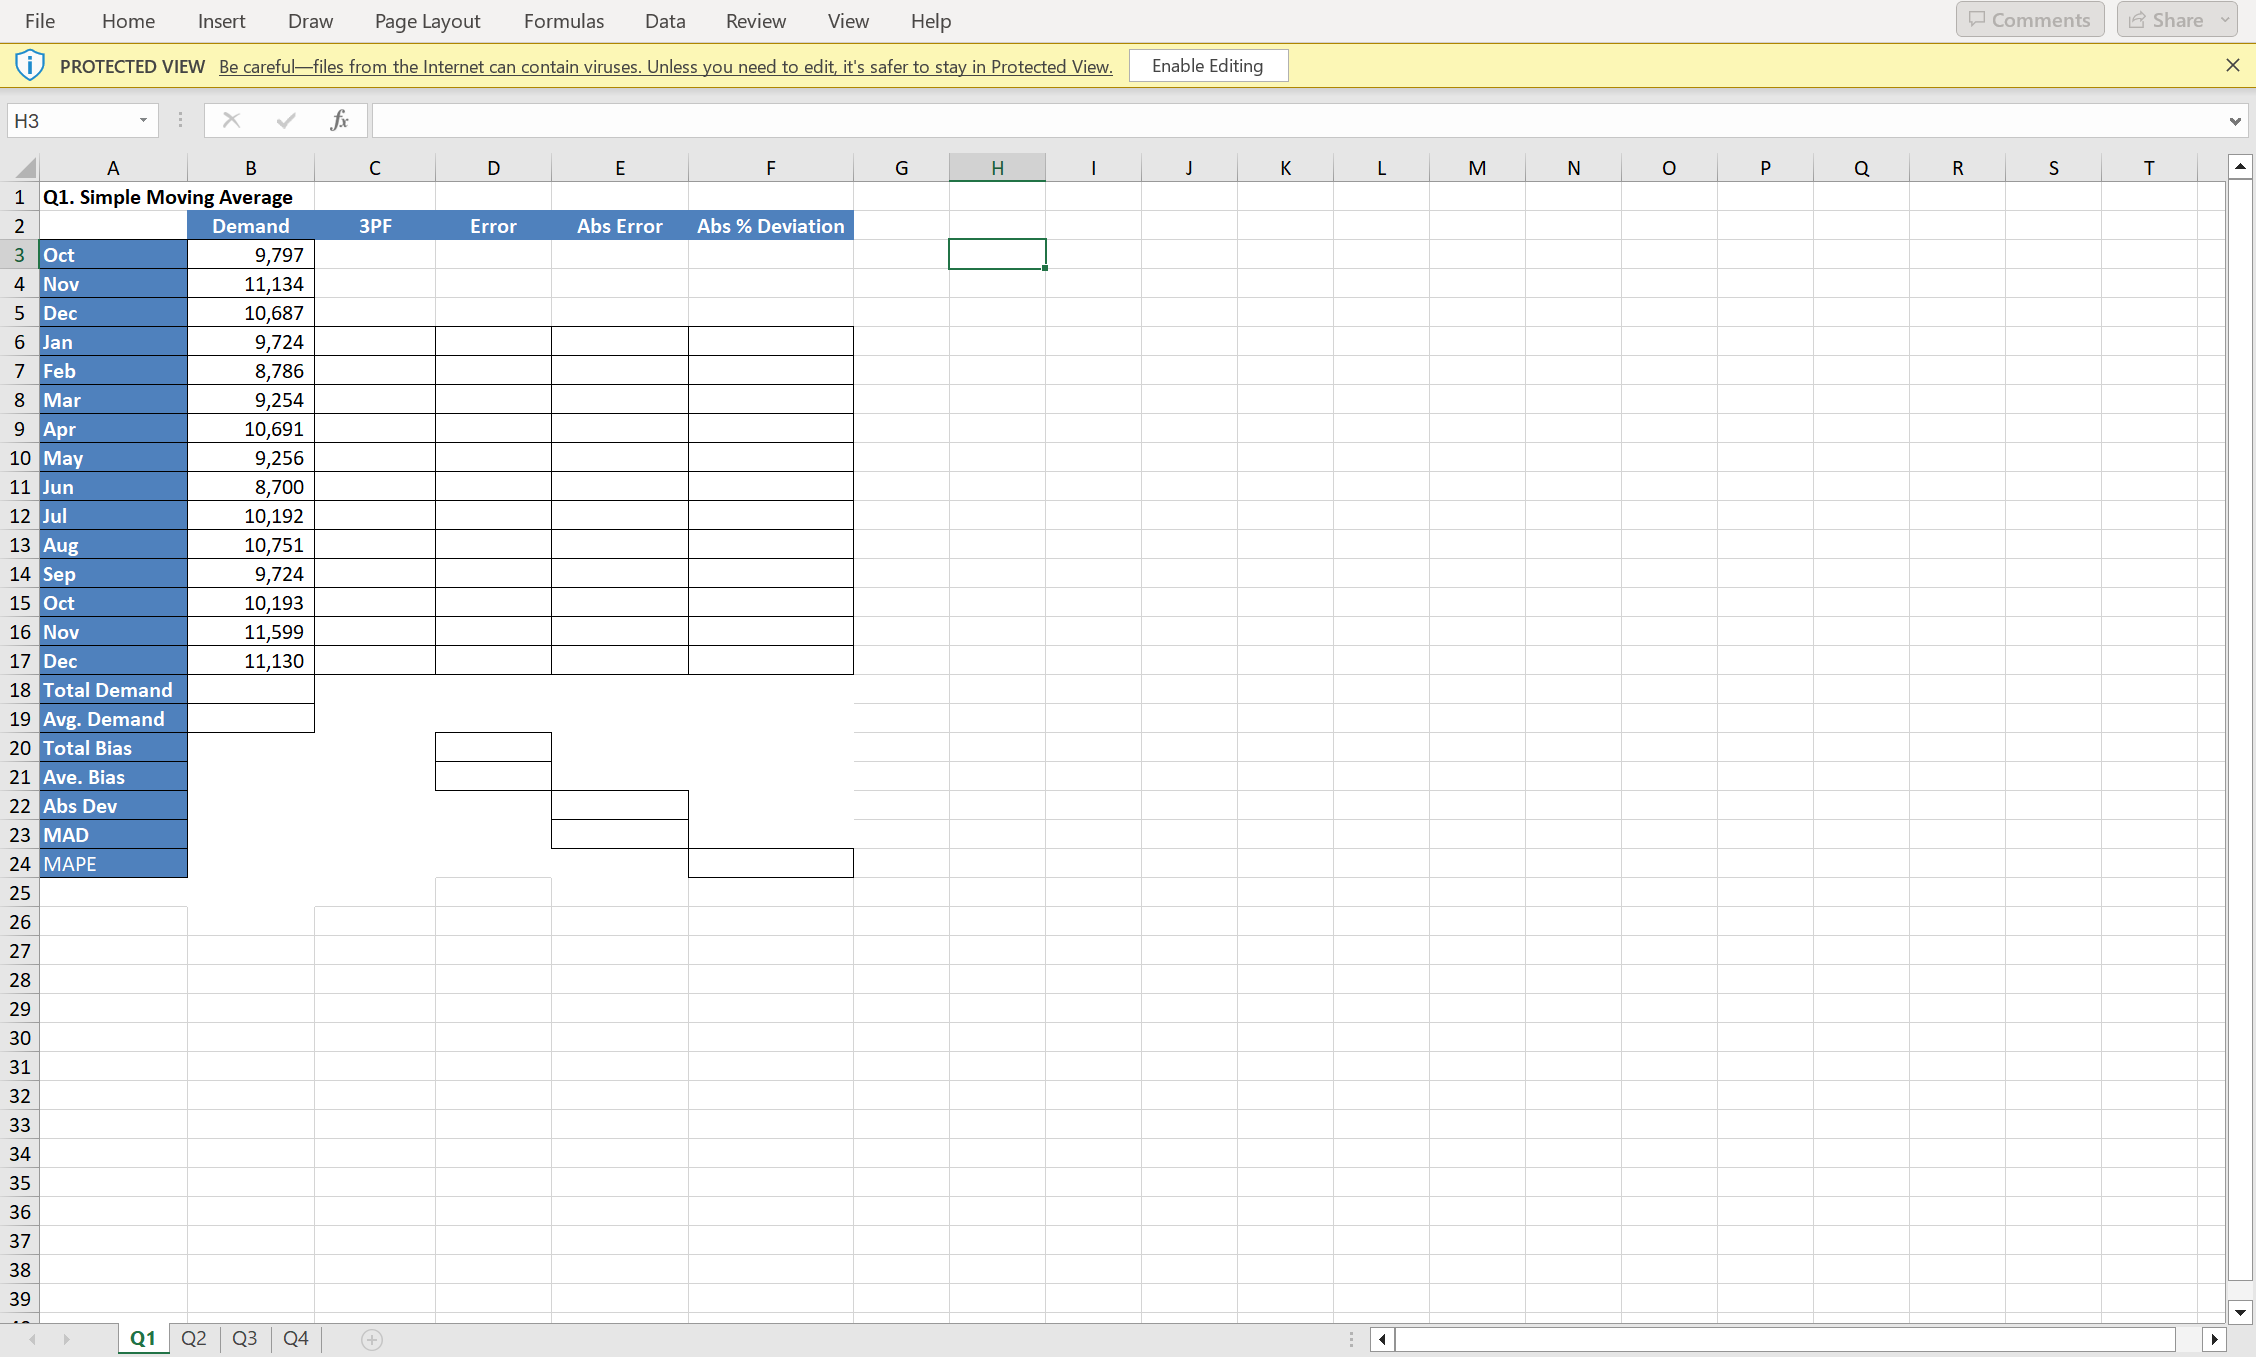
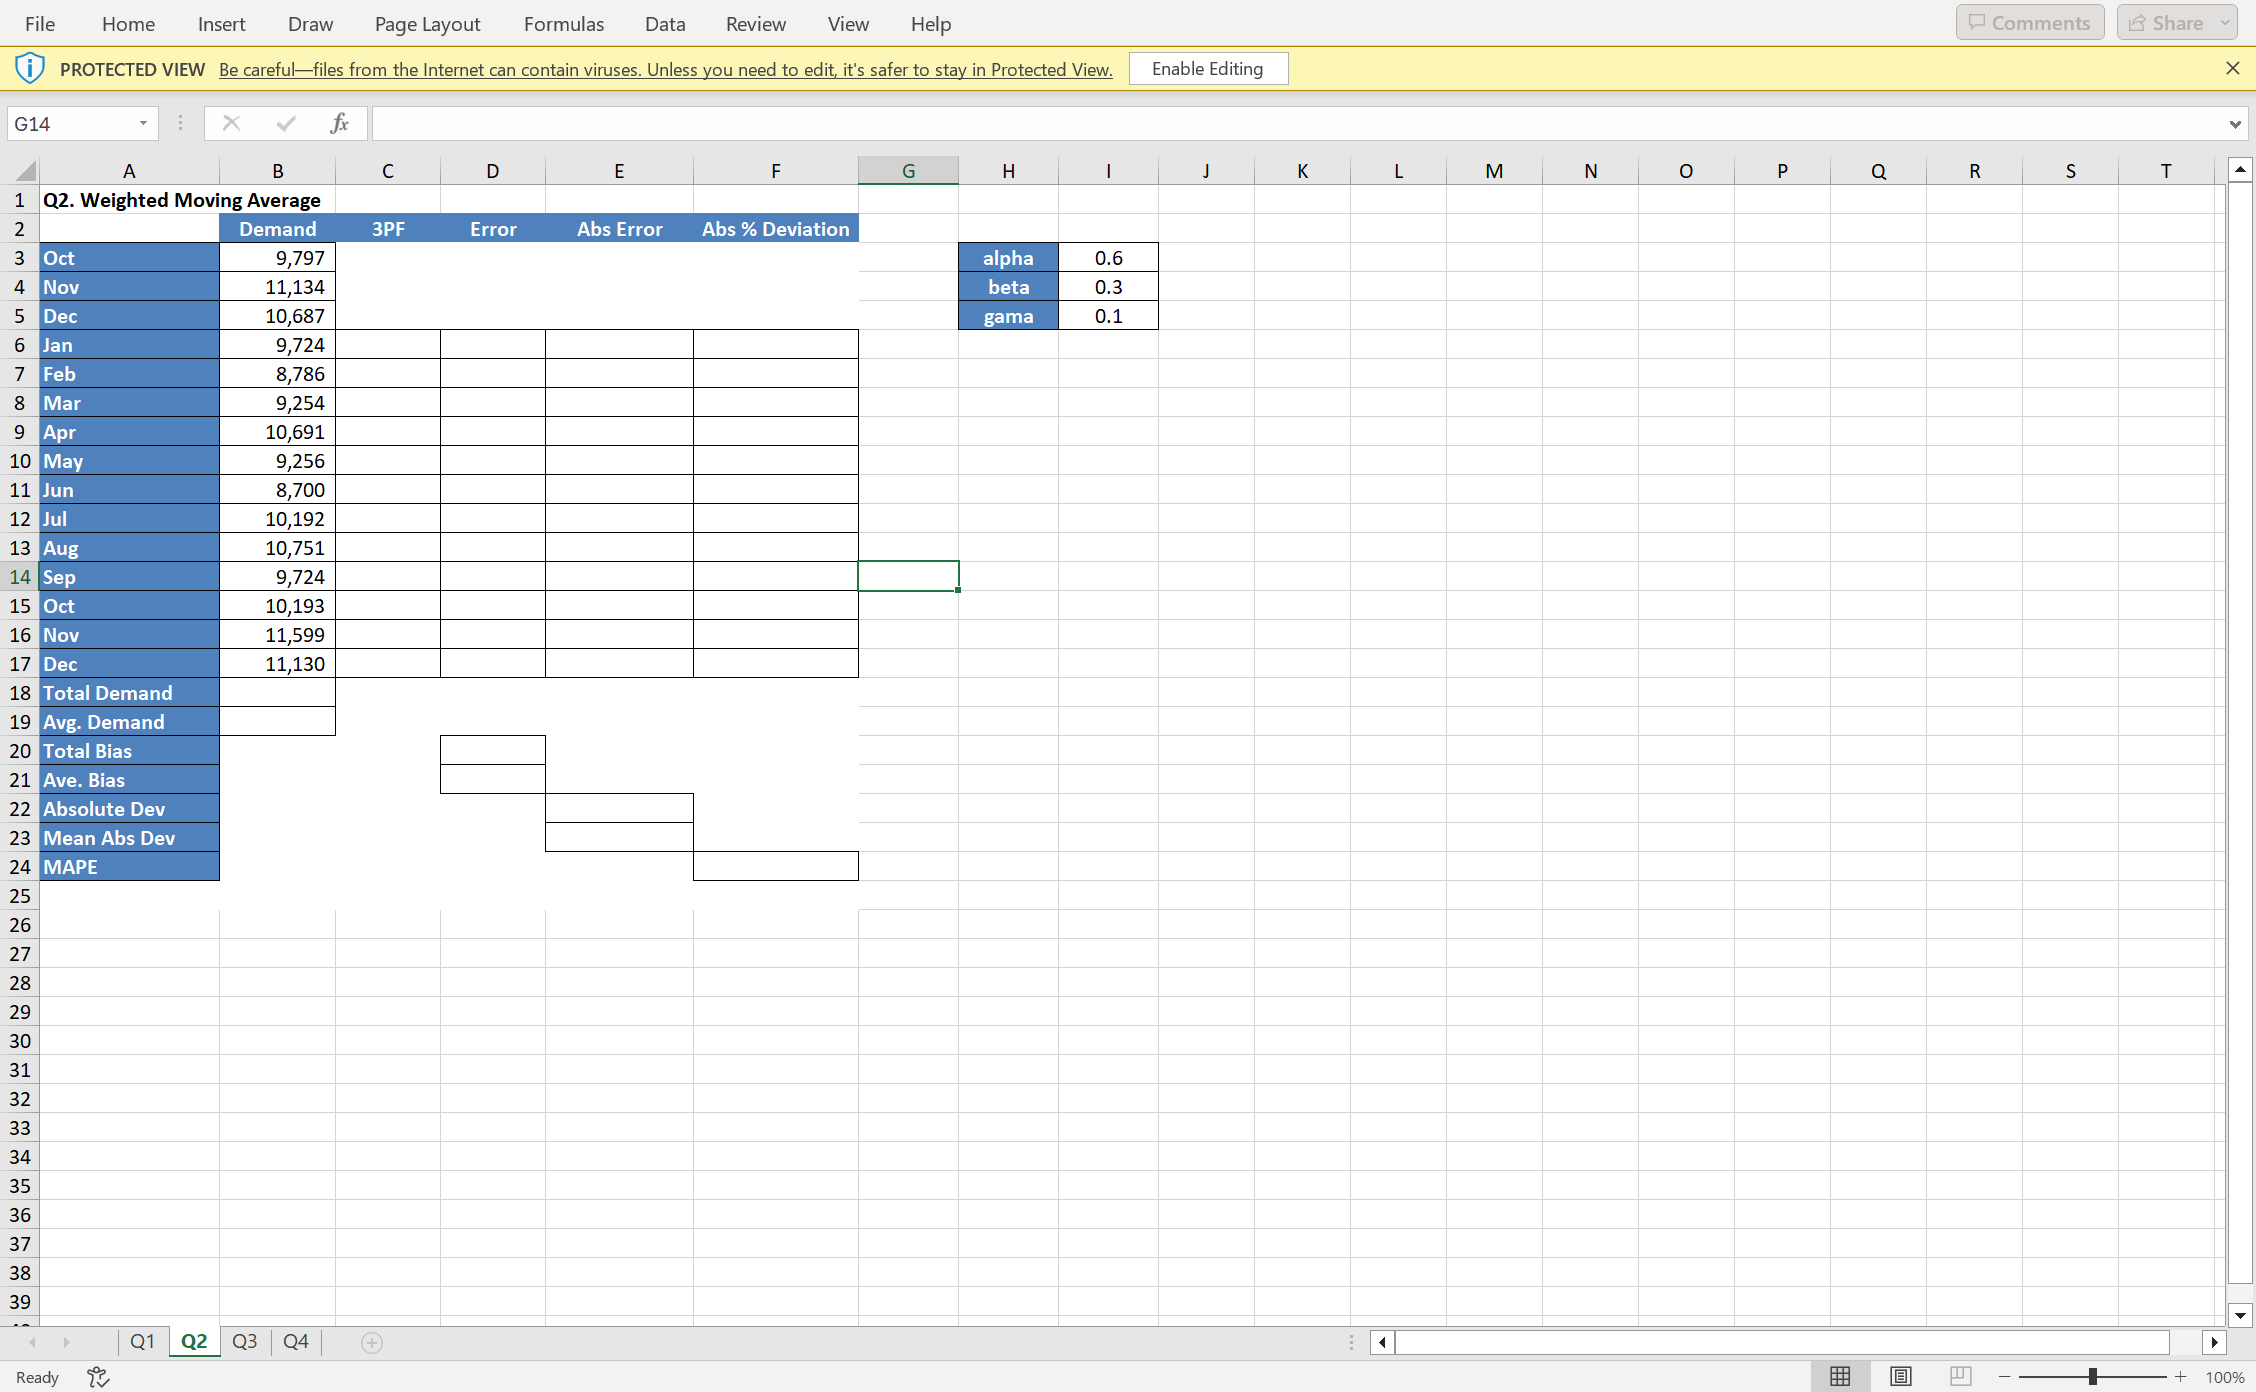
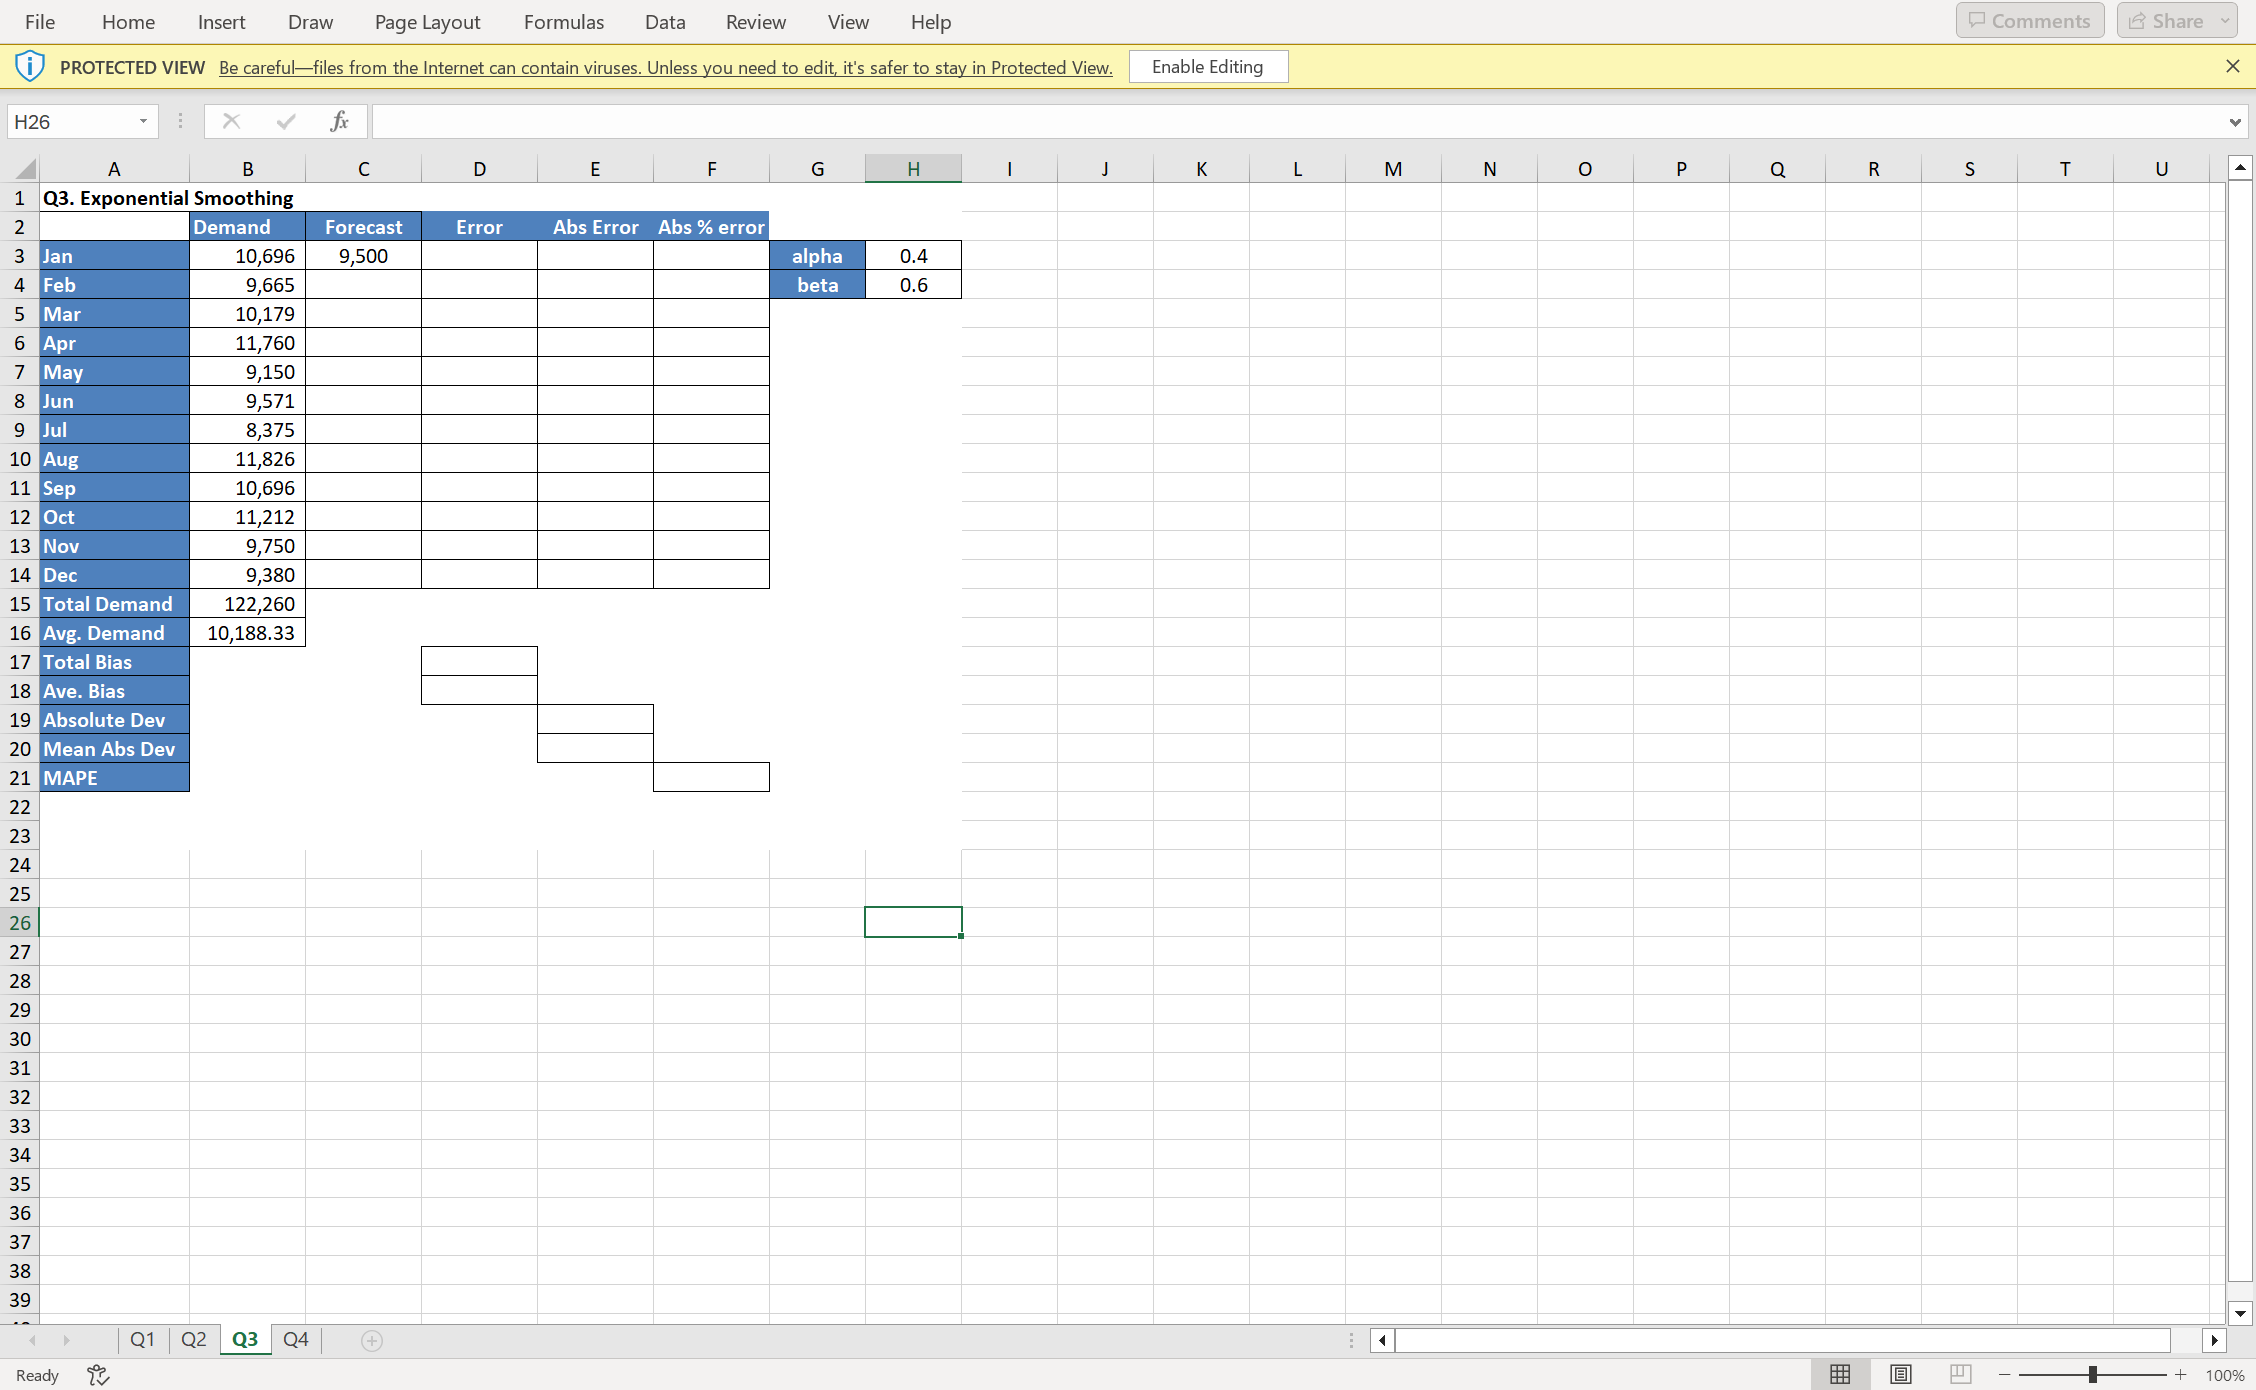
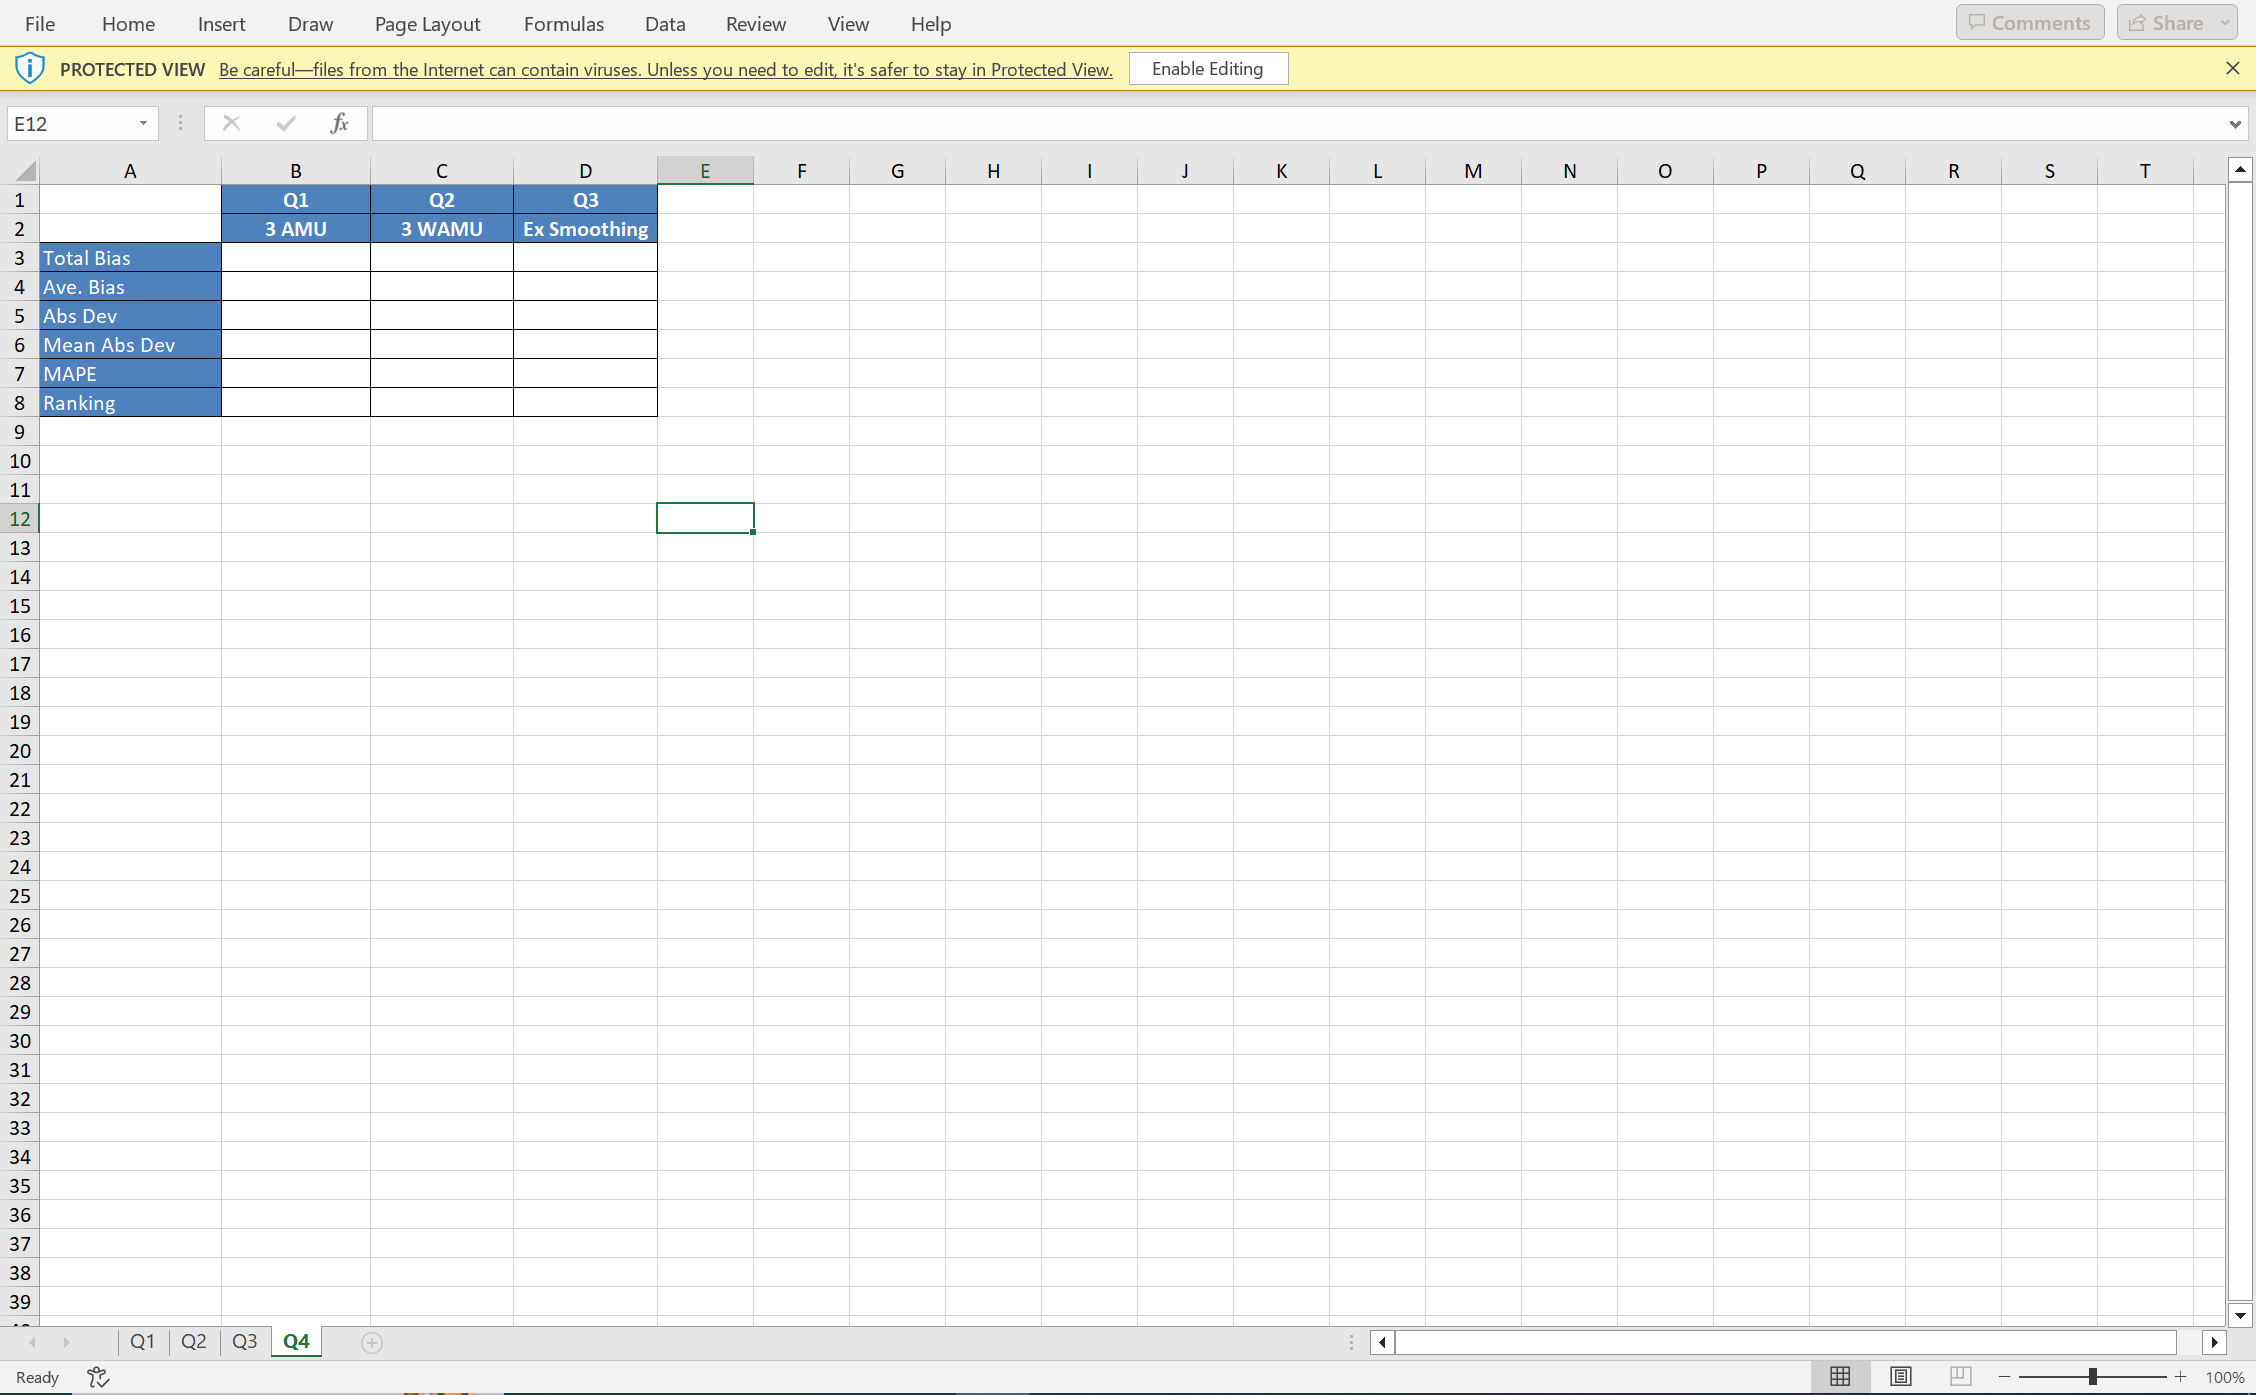
Case 7.1. Tires for You, Inc. Tires for You, Inc. (TFY), founded in 1987, is an automotive repair shop specializing in replacement tires. Located in Altoona. Pennsylvania. TFY has grown successfully over the past few years because of the addition of a new general manager. Ian Overbaugh. Since tire replacement is a major portion of TFY's business (it also performes oil changes, small mechanical repairs, etc.). lan was surprised at the lack of forecasts for tire consumption for the company. His senior mechanic, Skip Grenoble, told him that they usually stocked for this vear what they sold last year. He readily admitted that several times throughout the season stockouts ocourred and customers had to go elsewhere for tires. Although many tire replacements were for defective or destroyed tires, most tires were installed on cars whose original tires had worn out. Most often, four tires were installed at the same time. Ian was determined to get a better idea of how many tires to hold in stock during the various months of the year. Listed below is a summary of individual tire sales by month: PERIOD TIRES USED 2018 October 9,797 November 11,134 December 10,687 2019 January 9,724 February 8,786 March 9,254 April 10,691 May 9,256June 8,700 July 10,192 August 10,751 September 9,724 October 10,193 November 11,599 December 11,130Ian has hired you to determine the best technique for forecasting IFY demand based on the given data. Case Questions 1. Calculate a forecast using a simple three-month moving average. 2. Calculate a forecast using a three-period weighted moving average. Use weights of 0.60, 0.30, and 0.10 for the most recent period, the second most recent period, and the third most recent period, respectively. 3. Calculate a forecast using the exponential smoothing method. Assume the forecast for period 1 is 9,500. Use alpha = 0.40. 4. Once you have calculated the forecasts based on the above data, determine the error terms by comparing them to the actual sales for 2020 given below:PERIOD TIRES USED 2020 January 10,696 February 9,665 March 10,179 April 11,760 May 9,150 June 9,571 July 8,375August 11,826 September 10,696 October 11,212 November 9,750 December 9,380 5. Based on the three methods used to calculate a forecast for TFY, which method produced the best forecast? Why? What measures of forecast error did you use? How could you improve upon this forecast?File Home Insert Draw Page Layout Formulas Data Review View Help | B comments | | & Share ~| (i) PROTECTED VIEW Be carefulfiles from the Intenet can contain viruses. Unless you need to edit, it's safer o stay in Protected View. | Enable Editing X H3 o e v A | B | c b E | F [ | J R s T - L Q1. Simple Moving Average L A R B ) Total Demand Avg. Demand Total Bias Ave. Bias LD Y MAD (NS Q1 | Q2 | Q3 |Q4 ] File Home Insert Draw Page Layout Formulas Data Review View Help | B comments | | & Share ~| @ PROTECTED VIEW Be carefulfiles from the Internet can contain viruses. Unless you need to edit, it's safer to stay in Protected View. Enable Editing X G14 - I e v A | B | C | D | E | F | G | H 1 J K L M N o P Q R S T - L Q2. Weighted Moving Average Abs Error Abs % Deviation 0.6 0.3 0.1 Total Demand Avg. Demand Total Bias Ave. Bias Absolute Dev Mean Abs Dev LS 25| 2| 27 2 29| 30 a1 32 3| 34 35 3 37| 38 39 = - |1 @ Q3|4 i (4] | D Ready % | I 8+ 100% Comments Share File Home Insert Draw Page Layout Formulas Data Review View Help X i PROTECTED VIEW Be careful-files from the Internet can contain viruses. Unless you need to edit, it's safer to stay in Protected View. Enable Editing H26 X V B C D E F G H J K L M N P Q R S T U A 1 Q3. Exponential Smoothing Demand Forecast Error Abs Error Abs % error W N Jan 10,696 9,500 alpha 0.4 4 Feb 9,66 beta 0.6 5 Mar 10,179 6 Apr 11,760 7 May 9,150 8 Jun 9,571 9 Jul 8,375 10 Aug 11,826 11 Sep 10,696 12 Oct 11,212 13 Nov 9,750 14 Dec 9,380 15 Total Demand 122,260 16 Avg. Demand 10,188.33 17 Total Bias 18 Ave. Bias 19 Absolute Dev 20 Mean Abs Dev 21 MAPE 22 23 24 25 26 27 28 33 35 36 38 39 Q1 Q2 Q3 Q4 4 100% Ready\f
Step by Step Solution
There are 3 Steps involved in it
Lets break this down step by step 1 Simple ThreeMonth Moving Average Formula textForecast for Month ... View full answer

Get step-by-step solutions from verified subject matter experts