

Question: the case is base on the book problem. however the problem needs to be solve using the excel numbers and excel templates and formula Demand
the case is base on the book problem. however the problem needs to be solve using the excel numbers and excel templates and formula
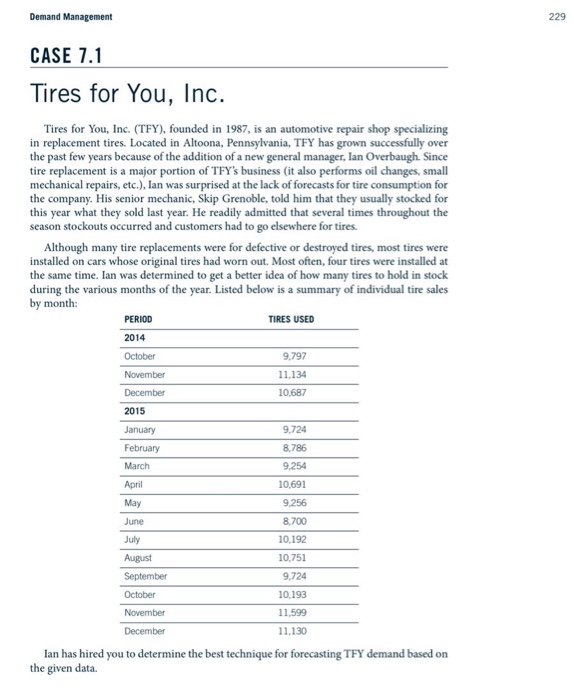
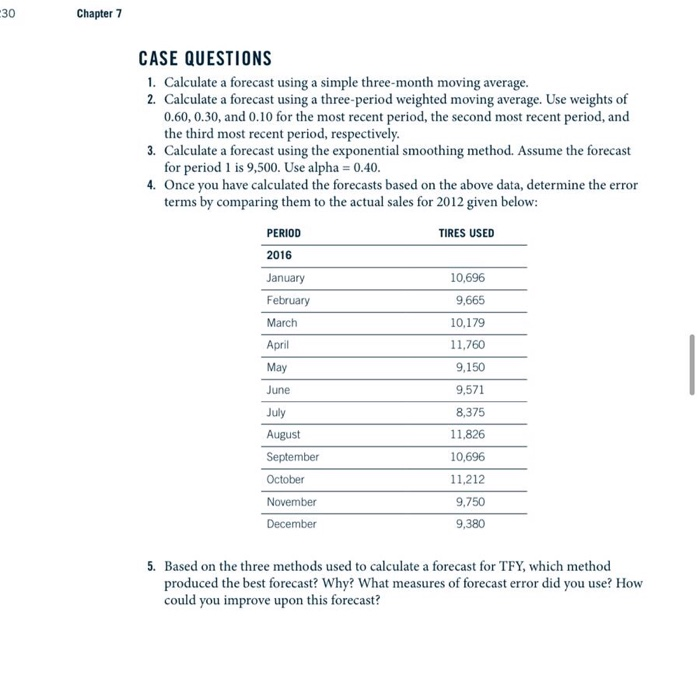
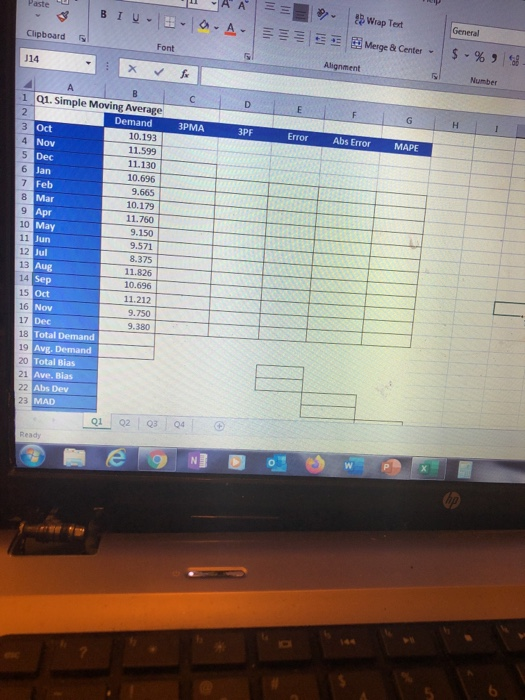
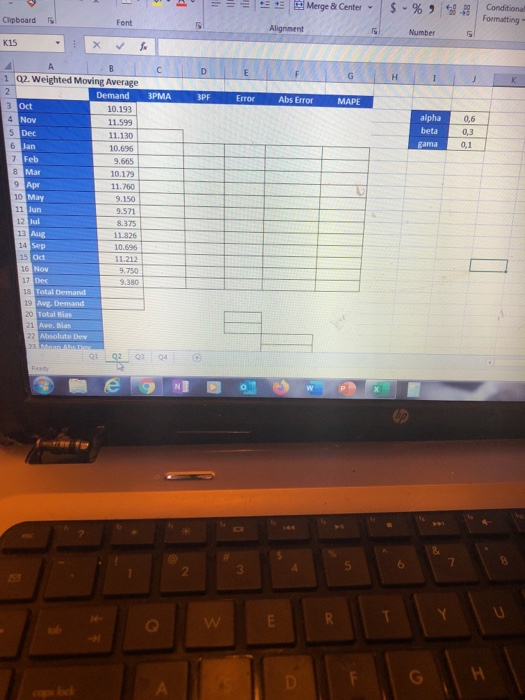
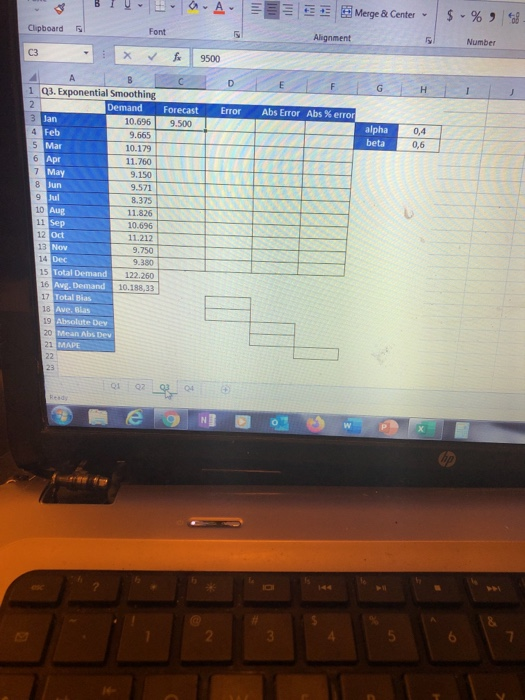
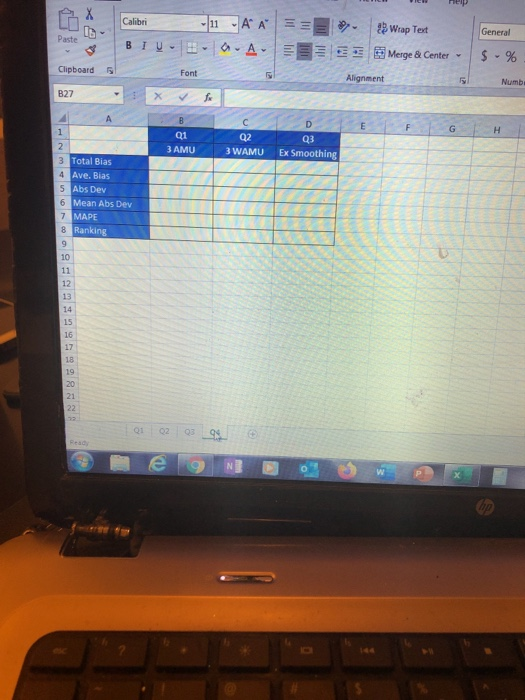
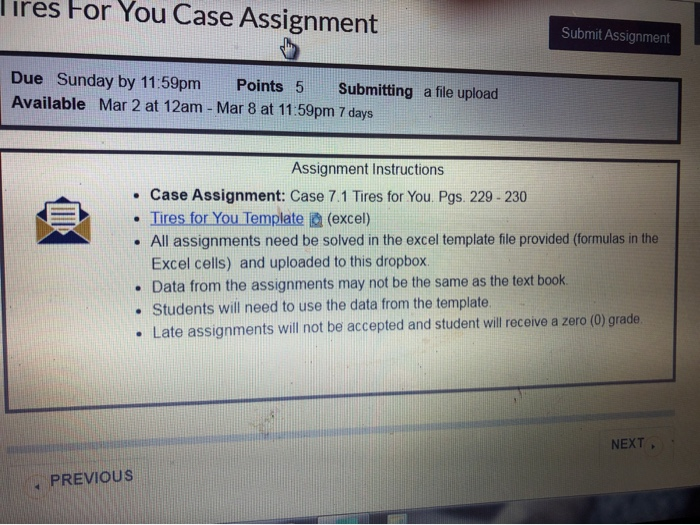
Demand Management CASE 7.1 Tires for You, Inc. Tires for You, Inc. (TFY), founded in 1987, is an automotive repair shop specializing in replacement tires. Located in Altoona, Pennsylvania, TFY has grown successfully over the past few years because of the addition of a new general manager, Ian Overbaugh. Since tire replacement is a major portion of TFY's business it also performs oil changes, small mechanical repairs, etc.), lan was surprised at the lack of forecasts for tire consumption for the company. His senior mechanic, Skip Grenoble, told him that they usually stocked for this year what they sold last year. He readily admitted that several times throughout the season stockouts occurred and customers had to go elsewhere for tires. Although many tire replacements were for defective or destroyed tires, most tires were installed on cars whose original tires had worn out. Most often, four tires were installed at the same time. Ian was determined to get a better idea of how many tires to hold in stock during the various months of the year. Listed below is a summary of individual tire sales by month: PERIOD TIRES USED 2014 October 9,797 November 11.134 December 10.687 2015 9.724 February 8.786 March 9.254 April 10.691 May 9,256 June 8,700 July 10.192 August 10.751 September 9.724 October 10,193 November 11,599 January December 11.130 lan has hired you to determine the best technique for forecasting TFY demand based on the given data. Chapter 7 CASE QUESTIONS 1. Calculate a forecast using a simple three-month moving average. 2. Calculate a forecast using a three-period weighted moving average. Use weights of 0.60, 0.30, and 0.10 for the most recent period, the second most recent period, and the third most recent period, respectively. 3. Calculate a forecast using the exponential smoothing method. Assume the forecast for period 1 is 9,500. Use alpha=0.40. 4. Once you have calculated the forecasts based on the above data, determine the error terms by comparing them to the actual sales for 2012 given below: PERIOD TIRES USED 2016 January February March April May 10,696 9,665 10,179 11,760 9,150 9,571 8,375 11.826 10,696 June July August September October November December 11,212 9,750 9,380 5. Based on the three methods used to calculate a forecast for TFY, which method produced the best forecast? Why? What measures of forecast error did you use? How could you improve upon this forecast? Paste -AA = 3 BIU-16-a-A- Font Clipboard ? Wrap Test Merge & Center - General E s J14 $ - % Alignment . Number G H Abs Error MAPE BICIDE 1 Q1. Simple Moving Average Demand 3PMA 3 Oct 3PF Error 10.193 4 Nov 11.599 5 Dec 11.130 6 Jan 10.696 7 Feb 9.665 8 Mar 10.179 9 Apr 11.7601 10 May 9.150 11 Jun 9.571 8.375 13 Aug 11.826 14 Sep 10.696 15 Oct 11.212 16 Nov 9.750 17 Dec 9.380 18 Total Demand 19 Avg. Demand 20 Total Bias 21 Ave. Bias 22 Abs Dev 23 MAD 01 02 03 04 Ready - E s Merge & Center - $ - % ) 8- Clipboard Conditional Formatting Font Alignment Numbers A B D E F G H 2 3PF Error Abs Error MAPE 0,6 alpha beta sama 0,1 K15 4 1 02. Weighted Moving Average Demand 3PMA 3 Oct 10.193 4 Nov 11.599 5 Dec 11.130 6 lan 10.695 7 Feb 9,665 8 Mar 10.179 9 Apr 11.760 10 May 9.150 11 Jun 9.571 12 Jul 8.375 13 Aug 11.826 10.696 15 Oct 11.212 16 NON 9.750 17 Dec 18 Total Demand 19 Avg. Demand 20. Total Bias 21 e. Bias 22 Absolute Dev 2 21 22 23 24 TI 14 Sep e 9 NE U A E Clipboard Merge & Center - Alignment 5 Font $ - % Number 9500 f C D E F G H I J Forecast 9.500 Error Abs Error Abs % error alpha beta L - : * A B 1 Q3. Exponential Smoothing Demand 3 Jan 10.696 4 Feb 9.665 5 Mar 10.179 6 Apr 11.760 7 May 9.150 8 Jun 9.571 9 Jul 8.375 10 Aug 11.826 11 Sep 10.696 12 Oct 11.212 13 Nov 9.750 14 Dec 9.380 15 Total Demand 122260 16 Av Demand 10.188.33 17 Total Bias 18 Ave, Blas 19 Absolute Dey 20 Mean Abs Dey 21 MADE L m g Mg Calibri BIU-B B 11 A A A A . General Pasta Wrap Text Merge & Center - $ - % Font Clipboard B27 Alignment Numb : x A E F G H Q1 3 AMU Q2 3 WAMU D Q3 Ex Smoothing 3 Total Bias 4 Ave. Bias 5 Abs Dev 6 Mean Abs Dev 7 MAPE 8 Ranking 01 02 03 0 e 9 Tires For You Case Assignment Submit Assignment Due Sunday by 11:59pm Points 5 Submitting a file upload Available Mar 2 at 12am - Mar 8 at 11:59pm 7 days Assignment Instructions Case Assignment: Case 7.1 Tires for You. Pgs. 229-230 . Tires for You Template @ (excel) All assignments need be solved in the excel template file provided (formulas in the Excel cells) and uploaded to this dropbox. . Data from the assignments may not be the same as the text book. Students will need to use the data from the template Late assignments will not be accepted and student will receive a zero (0) grade NEXT PREVIOUS Step by Step Solution
There are 3 Steps involved in it
1 Expert Approved Answer
Step: 1 Unlock

Question Has Been Solved by an Expert!
Get step-by-step solutions from verified subject matter experts
Step: 2 Unlock
Step: 3 Unlock