

Question: I do not need help with the graph, but I am having trouble with the other problems. Do you need help with this problem or
I do not need help with the graph, but I am having trouble with the other problems.
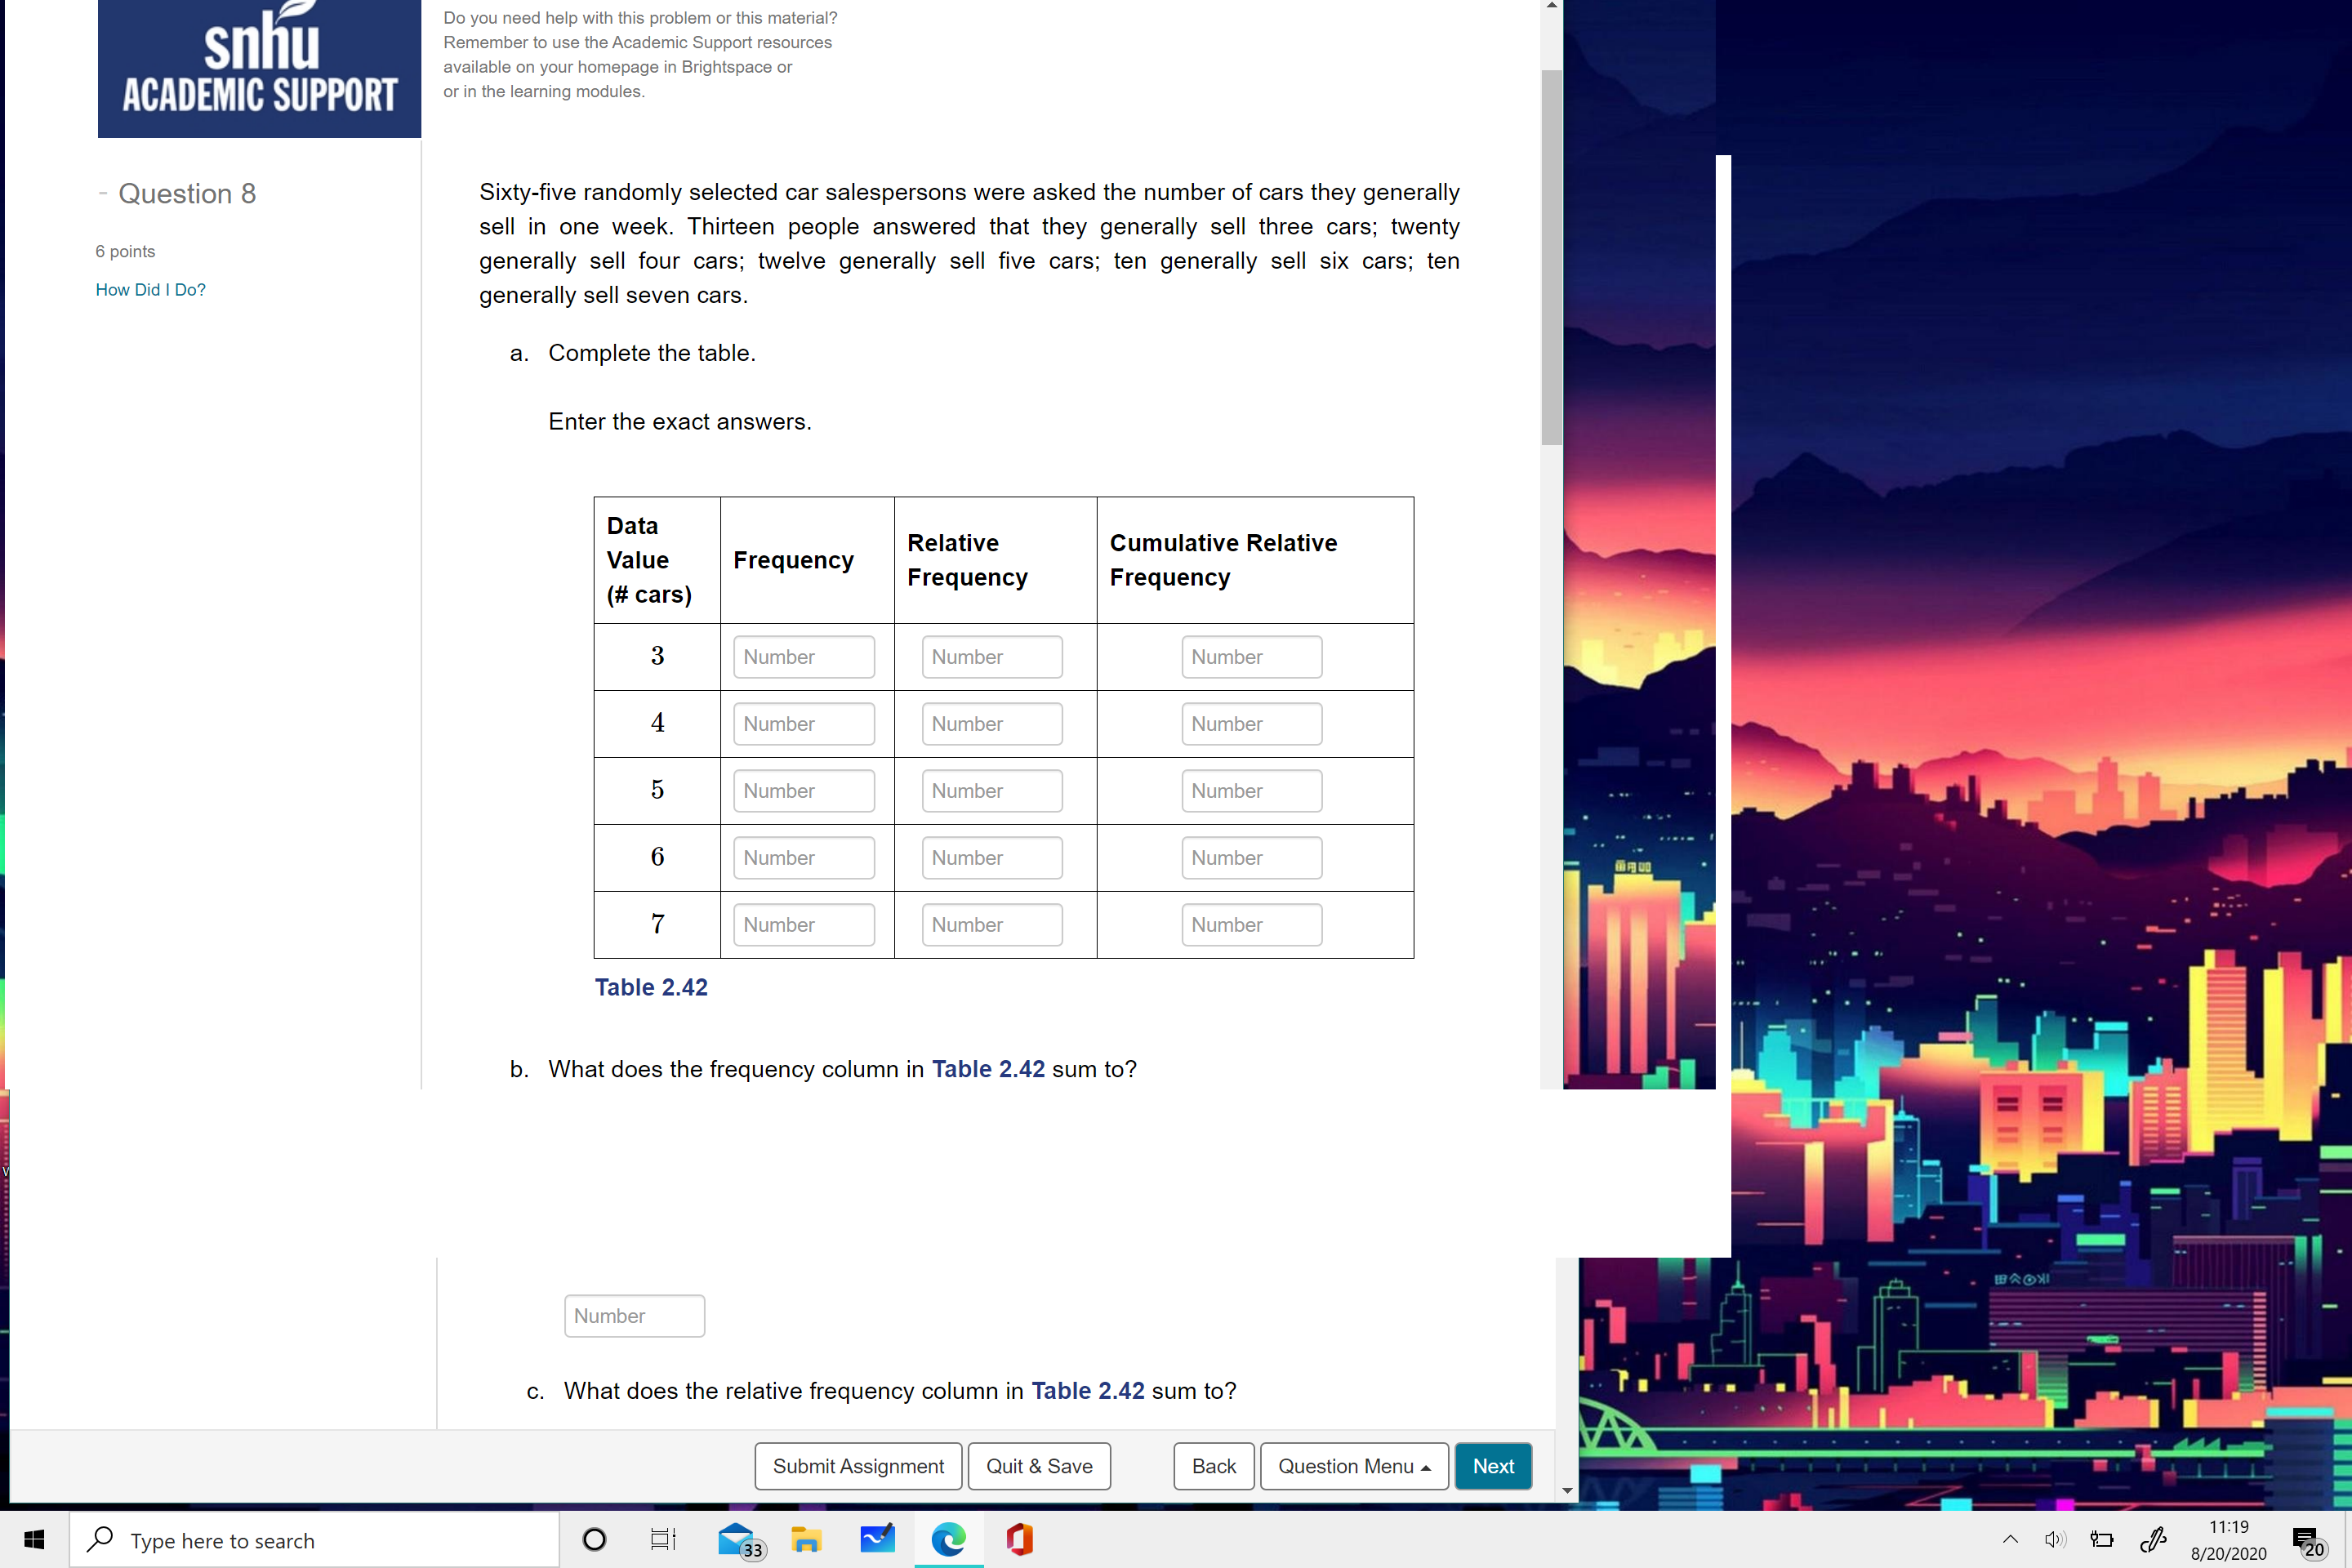
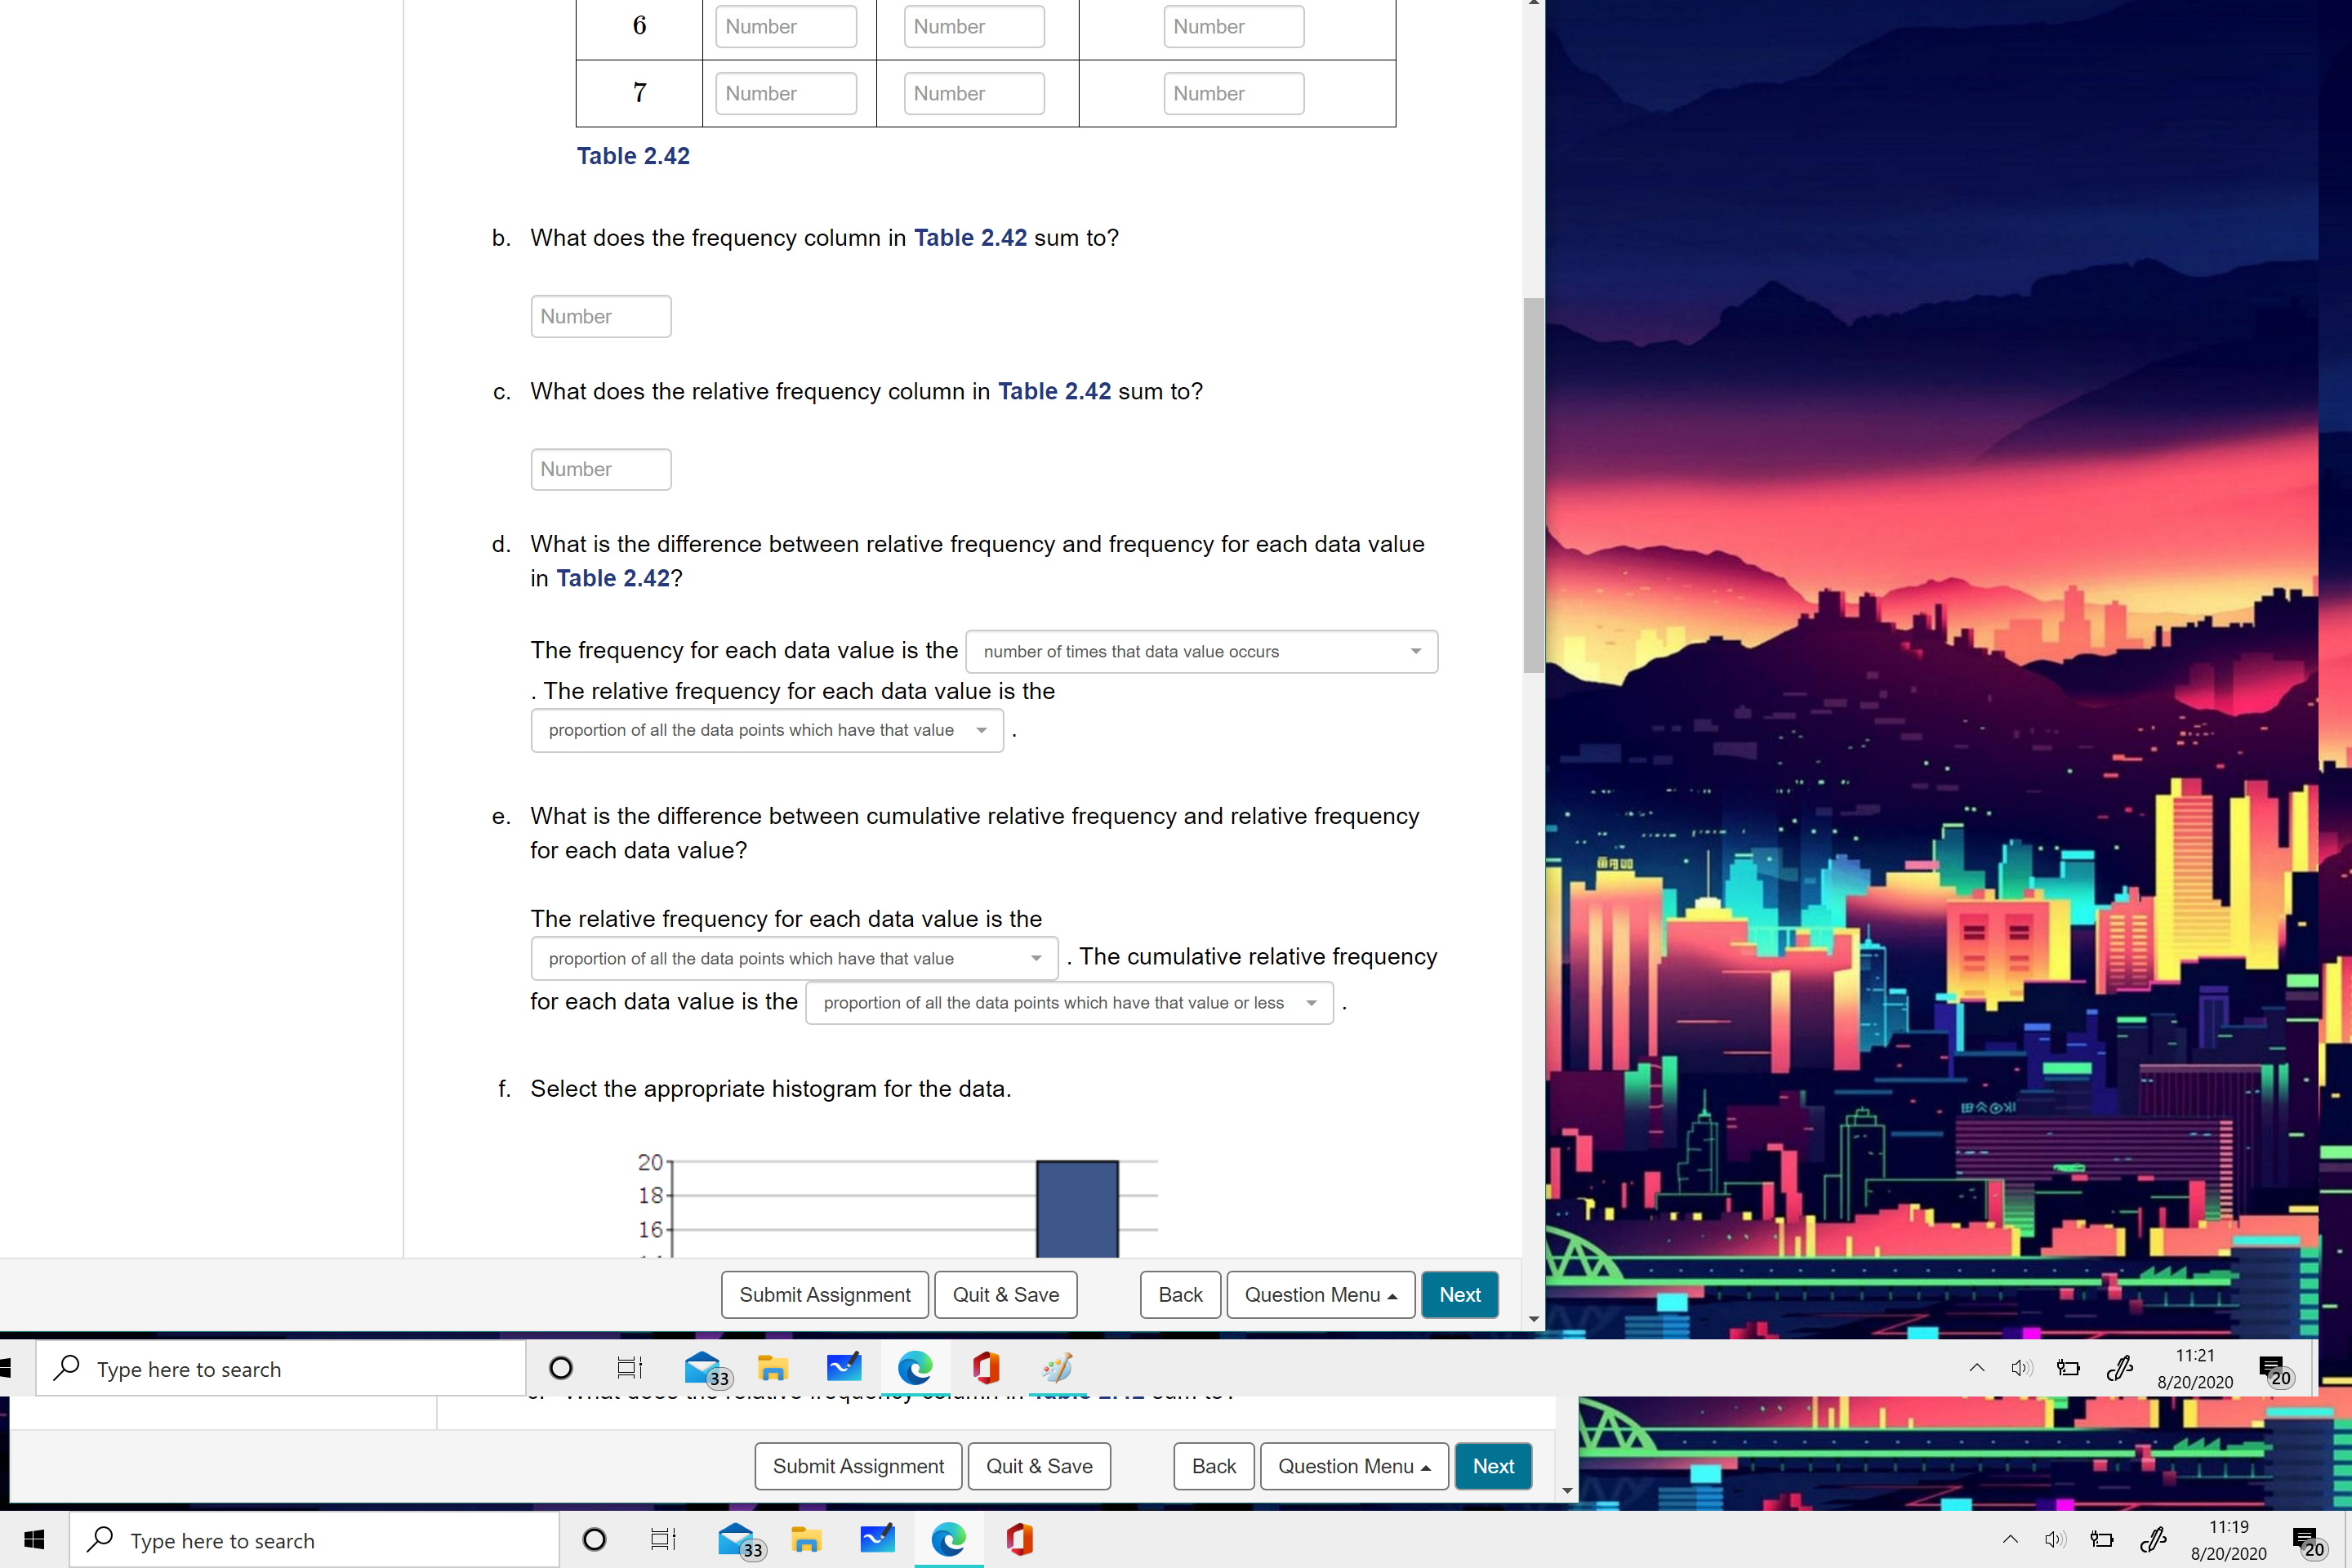
Do you need help with this problem or this material? 5\" u Remember to use the Academic Support resources available on your homepage m Brightspace or ACADEMIC SUPPORT Question 8 Sixty-ve randomly selected car salespersons were asked the number of cars they generally sell in one week' Thirteen people answered that they generally sell three cars; twenty generally sell four cars; twelve generally sell five cars; ten generally sell six cars; ten Hm\" Did ' D\" generally sell seven cars. 6 polnts a. Complete the table. Enter the exact answers, 3:; Frequency Relative Cumulative Relative (# cars) Frequency Frequency 3 Number Number Number 4 Number Number Number 5 Number Number Number 6 Number Number Number 7 Number Number Number Table 2.42 b. What does the frequency column in Table 2.42 sum to? Number 0, What does the relative frequency column in Table 2.42 sum to? ' Back ll Question Menu. _ l SubmitAssignment ll Quit&Save l I ,0 Type heretosearch 0 ii % Fl A G)? D J) SIZE/1:20 b 6 Number Number Number 7 Number Number Number Table 2.42 b. What does the frequency column in Table 2.42 sum to? Number c. What does the relative frequency column in Table 2.42 sum to? Number d. What is the difference between relative frequency and frequency for each data value in Table 2.42? The frequency for each data value is the number of times that data value occurs The relative frequency for each data value is the proportion of all the data points which have that value e. What is the difference between cumulative relative frequency and relative frequency for each data value? The relative frequency for each data value is the proportion of all the data points which have that value . The cumulative relative frequency for each data value is the proportion of all the data points which have that value or less f. Select the appropriate histogram for the data. BBAOXI 20- 18- 16 Submit Assignment Quit & Save Back Question Menu - Next TIT Type here to search 11:21 8/20/2020 20 L Submit Assignment Quit & Save Back Question Menu - Next Type here to search O 33 F @ 11:19 8/20/2020 20
Step by Step Solution
There are 3 Steps involved in it

Get step-by-step solutions from verified subject matter experts