

Question: ????????? i do not understad Unanswered Question 34 0 / 12 ptS Using the data in Table 5, calculate the odds of being at the
????????? i do not understad
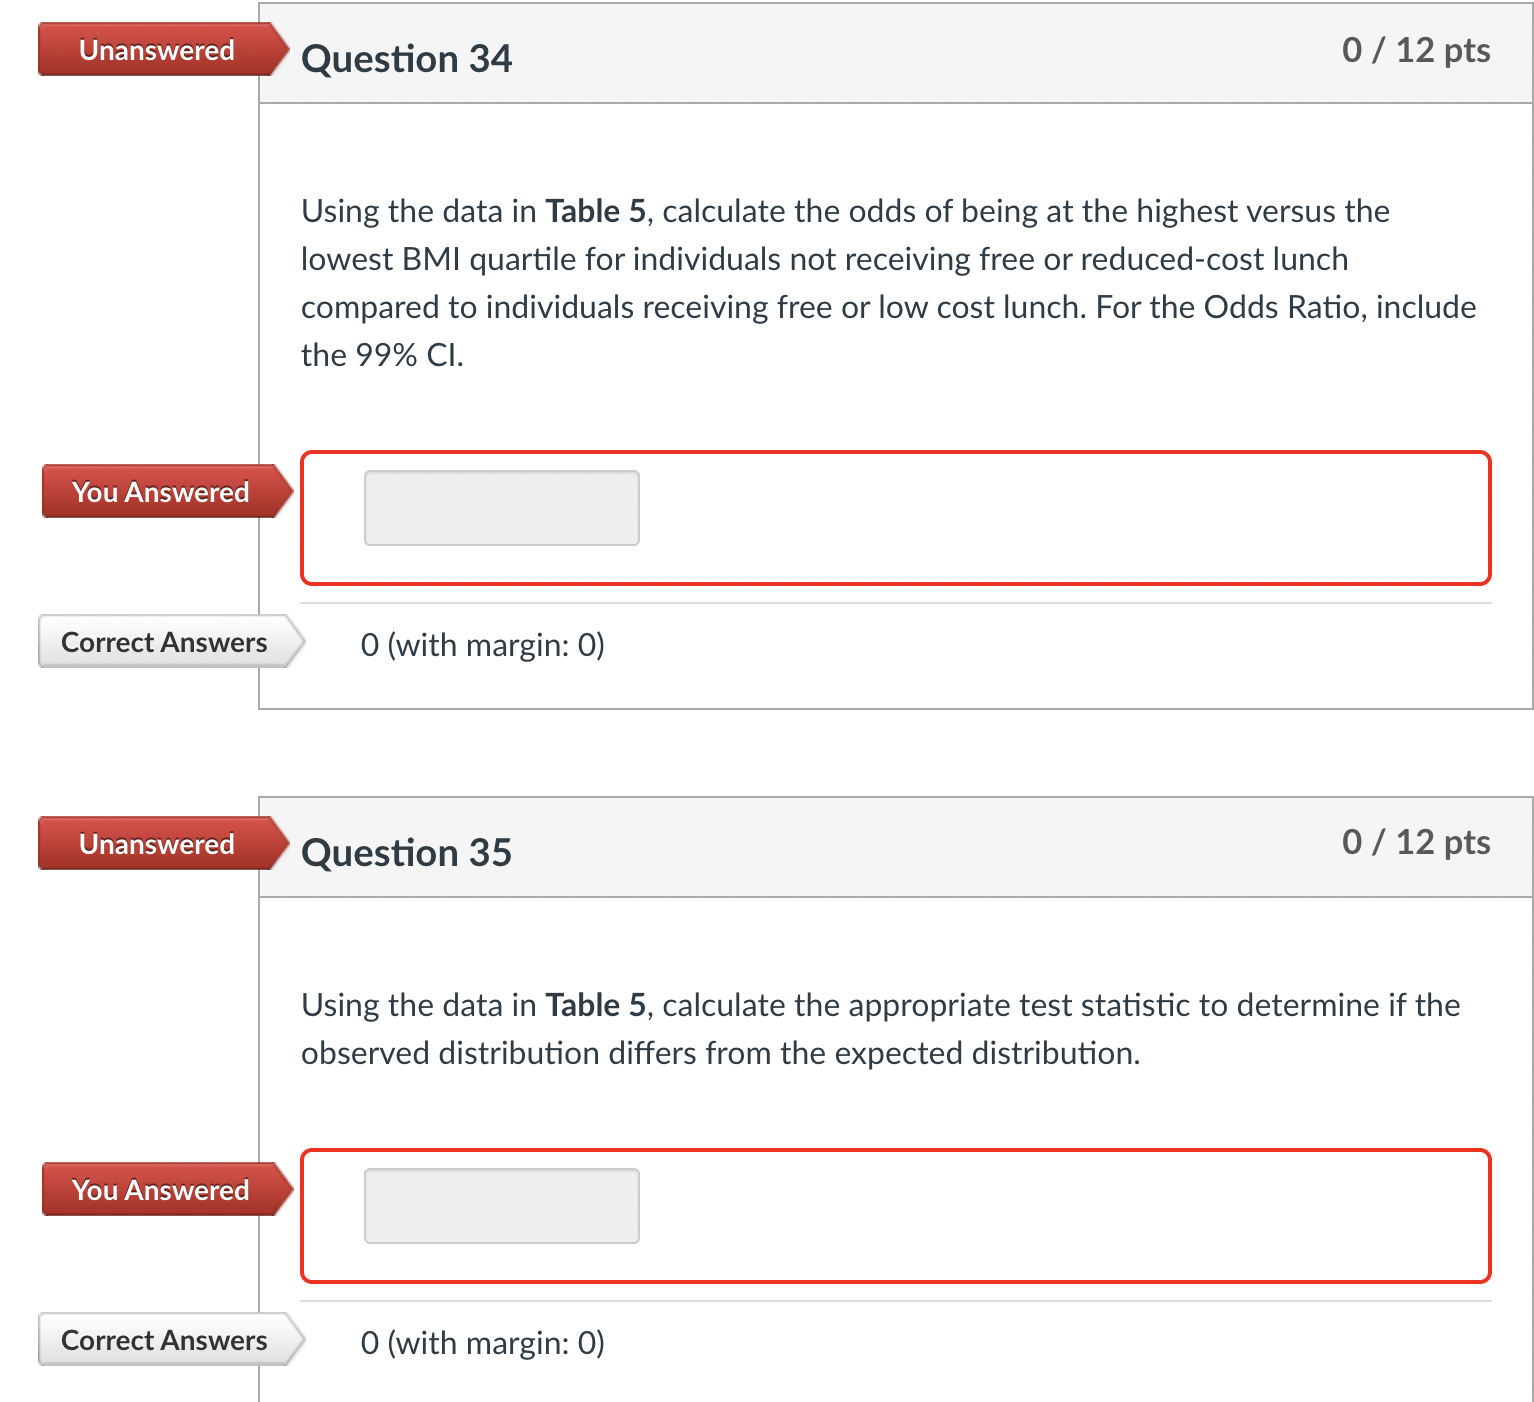
Unanswered Question 34 0 / 12 ptS Using the data in Table 5, calculate the odds of being at the highest versus the lowest BMI quartile for individuals not receiving free or reduced-cost lunch compared to individuals receiving free or low cost lunch. For the Odds Ratio, include the 99% Cl. You Answered Correct Answers 0 (with margin: 0} Unanswered Question 35 0 / 12 [.3115 Using the data in Table 5, calculate the appropriate test statistic to determine if the observed distribution differs from the expected distribution. You Answered - CorrectAnswers -> O (with margin: 0}
Step by Step Solution
There are 3 Steps involved in it
1 Expert Approved Answer
Step: 1 Unlock

Question Has Been Solved by an Expert!
Get step-by-step solutions from verified subject matter experts
Step: 2 Unlock
Step: 3 Unlock