

Question: I do not understand how graph is supposed to look. Please handwrite/insert picture of the graph for the answer to A. Suppose you have the
I do not understand how graph is supposed to look. Please handwrite/insert picture of the graph for the answer to A.
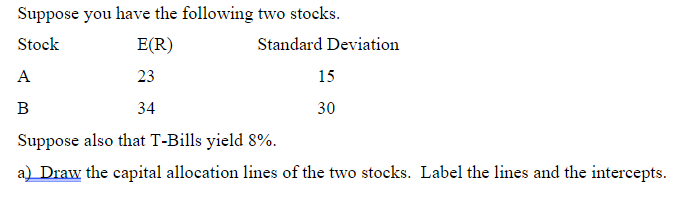
Suppose you have the following two stocks. Suppose also that T-Bills yield 8\%. a) Draw the capital allocation lines of the two stocks. Label the lines and the intercepts
Step by Step Solution
There are 3 Steps involved in it
1 Expert Approved Answer
Step: 1 Unlock

Question Has Been Solved by an Expert!
Get step-by-step solutions from verified subject matter experts
Step: 2 Unlock
Step: 3 Unlock