

Question: I don't know what I am doing wrong Problem 4: Titanic Dataset - Survival Rates In this problem, we will determine how passenger class and
I don't know what I am doing wrong
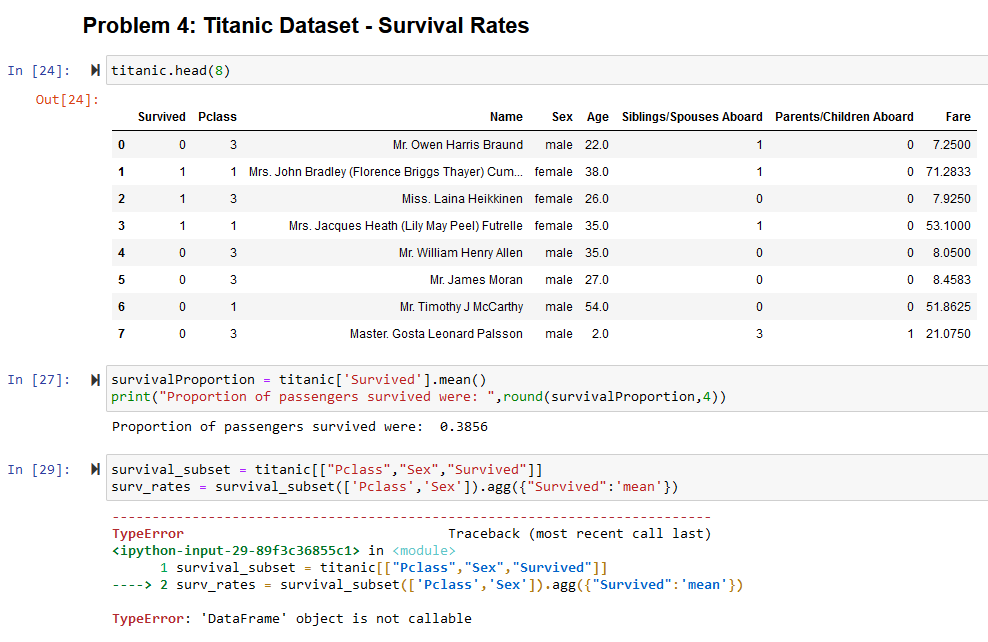
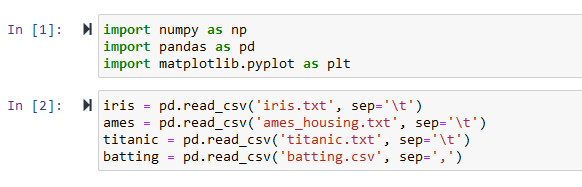
Problem 4: Titanic Dataset - Survival Rates In this problem, we will determine how passenger class and sex affected the survival rates of passengers on the Titanic. Use the head( ) method to display the first 8 rows of the titanic DataFrame. The Survived column in this DataFrame indicates whether or not a particular passenger survived, with a value of 1 indicating survival and a value of 0 indicating death. Because of the 0/1 encoding, the average of the values in this column will be equal to the proportion of passengers who survived. Calculate the average of the Survived column in the titanic DataFrame. You may use either np.mean() or the mean( ) DataFrame method. Print the results with a message in the format shown below. Round the numerical value to four decimal places. Proportion of Passengers who survived: xXXX 3 Passengers aboard the Titanic were assigned one of three classes: First Class, Second Class, and Third Class. We will now use grouping to determine the survival rates within each of the six groups determined by the three classes and the two sexes. Create a DataFrame named surv_rates by selecting the Pclass, Sex, and Survived columns from titanic, grouping the results by both Pclass and Sex, and then calculating the mean of each group. Display this DataFrame. \begin{tabular}{l|l} In [1]: M & importnumpyasnpimportpandasaspdimportmatplotlib.pyplotasplt \end{tabular} In [2]: N Problem 4: Titanic Dataset - Survival Rates
Step by Step Solution
There are 3 Steps involved in it

Get step-by-step solutions from verified subject matter experts