

Question: I dont understand hoe to cpmapre these grpahs. How do I compare the two distribustions of grades. I dont know the differnces between shape (mound
I dont understand hoe to cpmapre these grpahs.
How do I compare the two distribustions of grades. I dont know the differnces between shape (mound shaped, skewed, uni model, bi-model, spread (max,min) , and whats the central tendicies.
Please help as Im confused to what the graphs show.
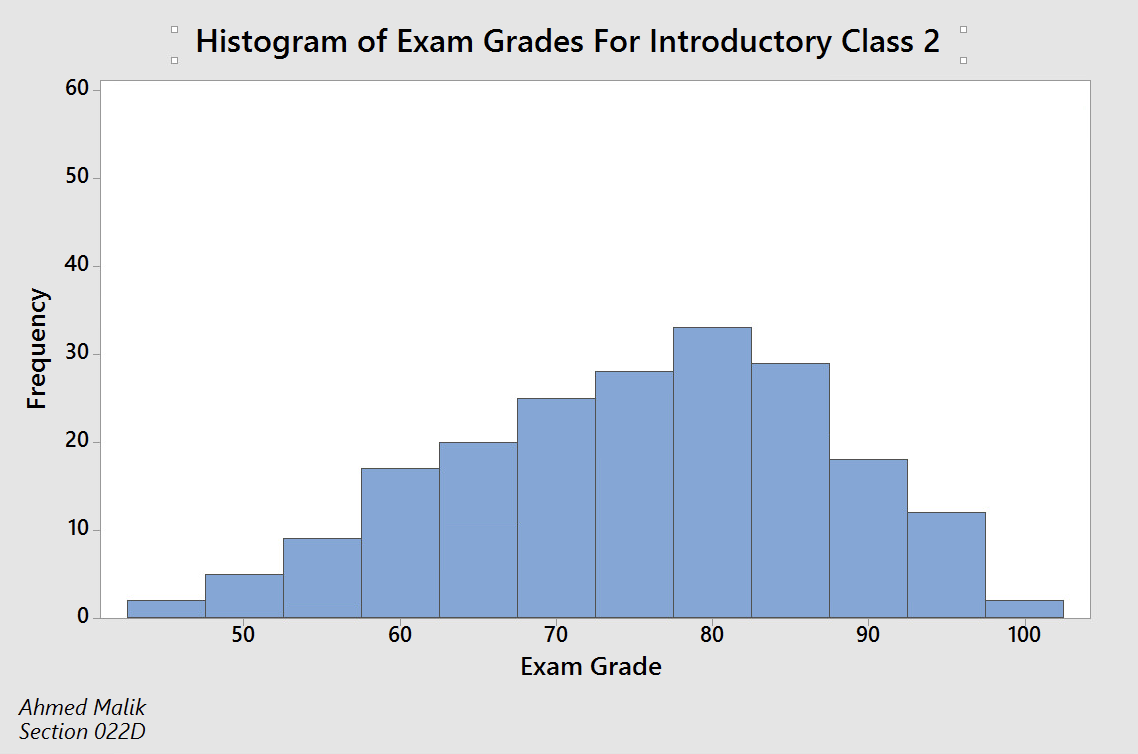
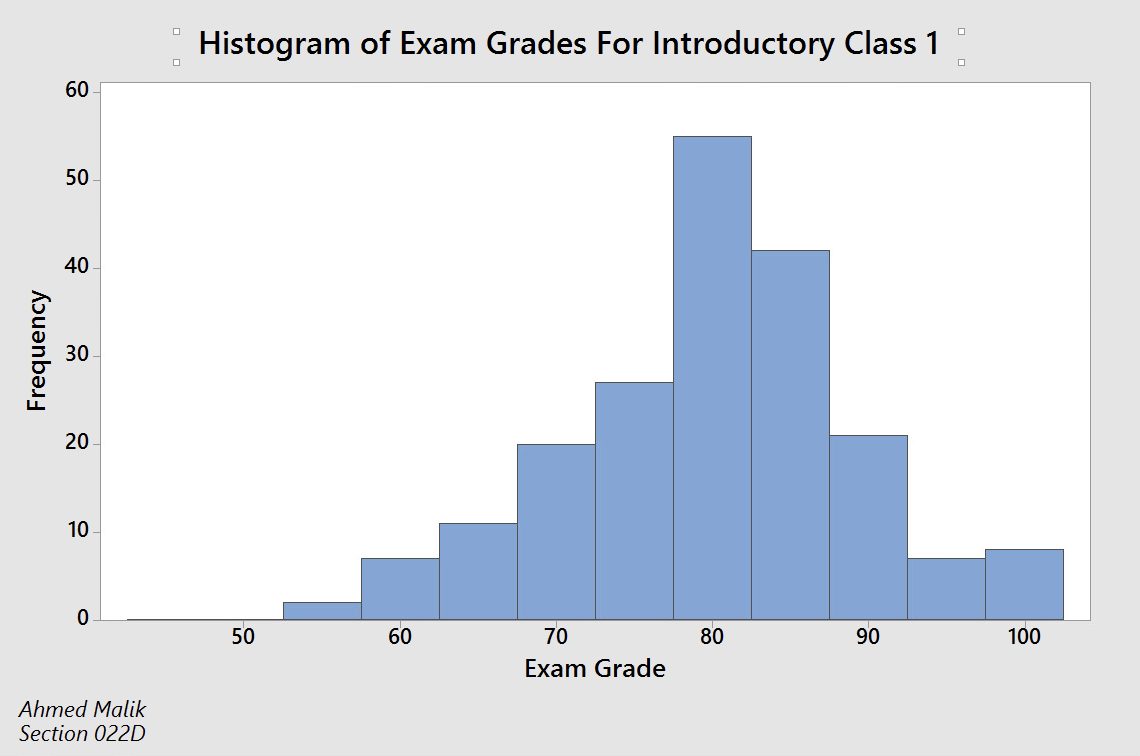
60 Histogram of Exam Grades For Introductory Class 2 50 40 Frequency 30 20 10 0 50 60 70 90 Exam Grade 100 Ahmed Malik Section 022D60 Histogram of Exam Grades For Introductory Class 1 50 40 Frequency 30 20 10 50 60 70 80 Exam Grade 90 100 Ahmed Malik Section 022D
Step by Step Solution
There are 3 Steps involved in it
1 Expert Approved Answer
Step: 1 Unlock

Question Has Been Solved by an Expert!
Get step-by-step solutions from verified subject matter experts
Step: 2 Unlock
Step: 3 Unlock