

Question: I dont understand the table, however viewing the text and what a quality cost report looks like, these are the answers that i received and
I dont understand the table, however viewing the text and what a quality cost report looks like, these are the answers that i received and when i checked it, they are wrong?
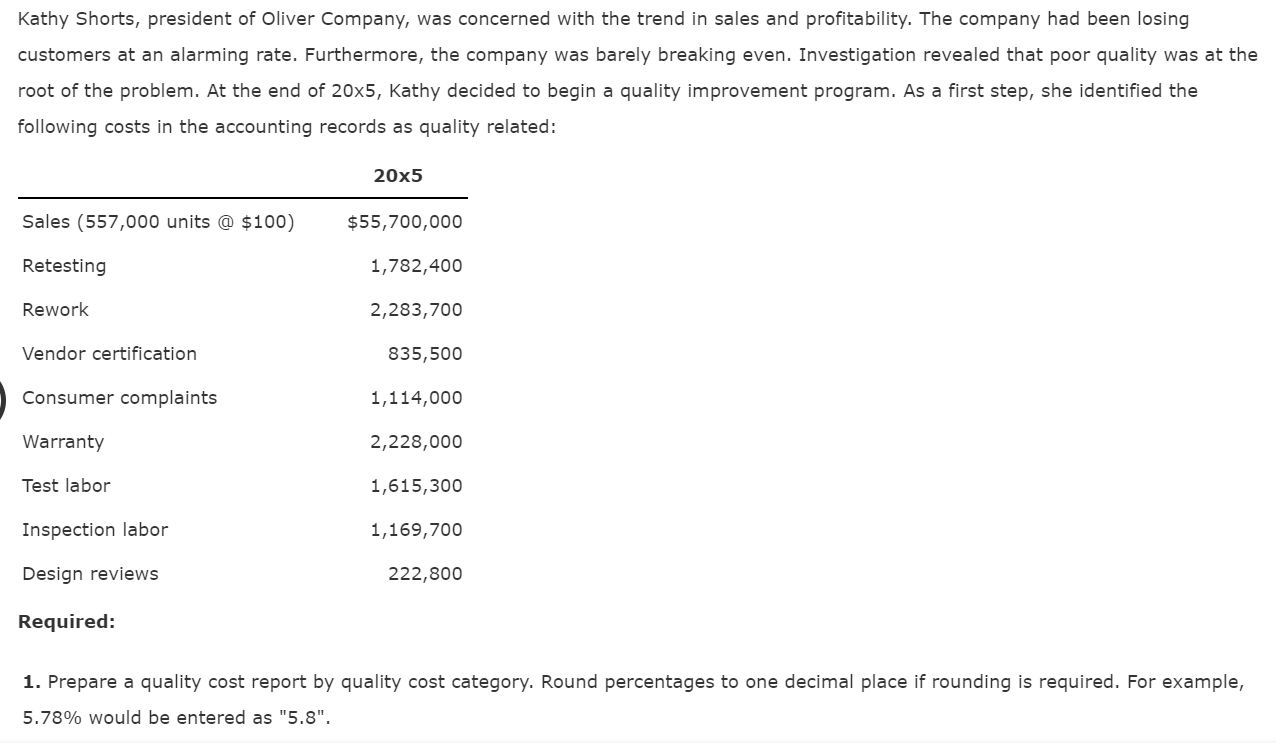
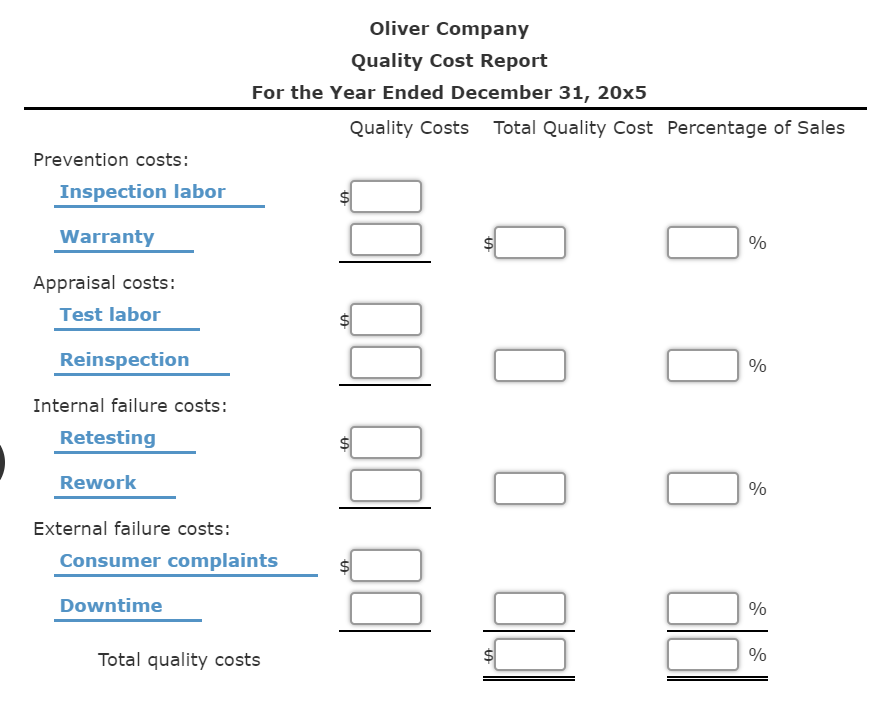
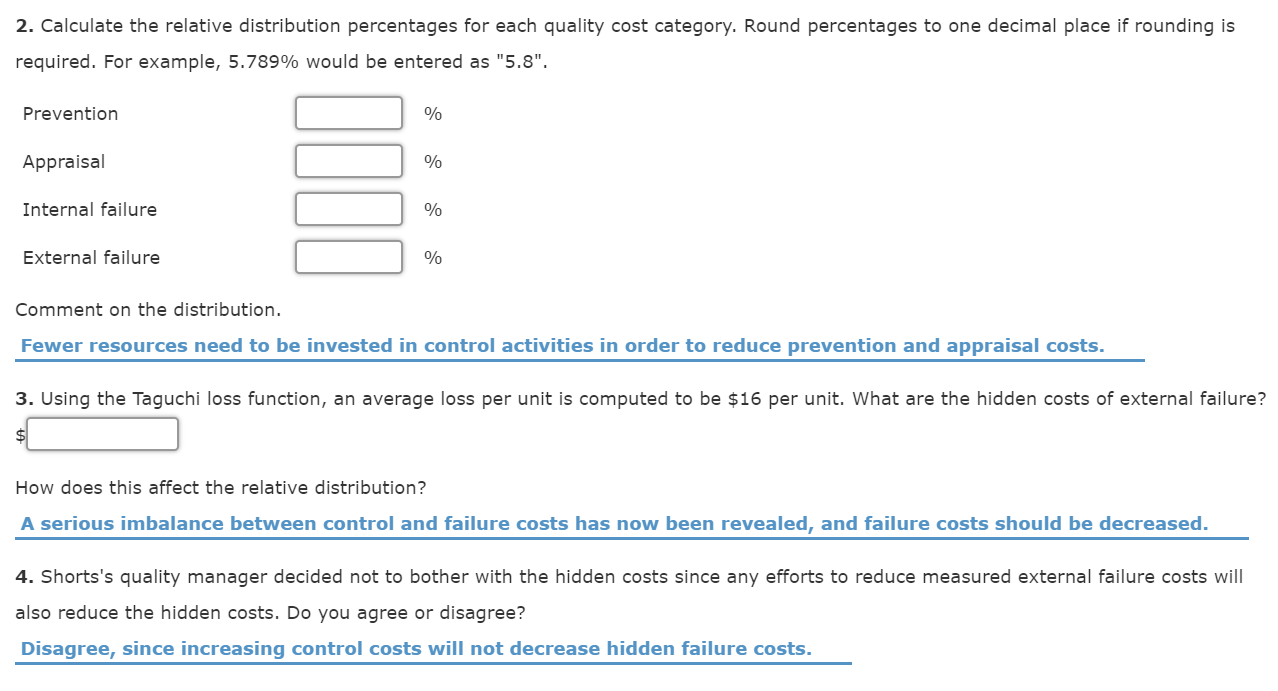
Kathy Shorts, president of Oliver Company, was concerned with the trend in sales and profitability. The company had been losing customers at an alarming rate. Furthermore, the company was barely breaking even. Investigation revealed that poor quality was at the root of the problem. At the end of 20x5, Kathy decided to begin a quality improvement program. As a first step, she identified the following costs in the accounting records as quality related: 20x5 Sales (557,000 units @ $100) $55,700,000 Retesting 1,782,400 Rework 2,283,700 Vendor certification 835,500 Consumer complaints 1,114,000 Warranty 2,228,000 Test labor 1,615,300 Inspection labor 1,169,700 Design reviews 222,800 Required: 1. Prepare a quality cost report by quality cost category. Round percentages to one decimal place if rounding is required. For example, 5.78% would be entered as "5.8". Oliver Company Quality Cost Report For the Year Ended December 31, 20x5 Quality Costs Total Quality Cost Percentage of Sales Prevention costs: Inspection labor $ Warranty $ % Appraisal costs: Test labor $ Reinspection O % Internal failure costs: Retesting II 00 00 00 Rework % External failure costs: Consumer complaints Downtime % Total quality costs % 2. Calculate the relative distribution percentages for each quality cost category. Round percentages to one decimal place if rounding is required. For example, 5.789% would be entered as "5.8". Prevention % Appraisal % Internal failure % External failure % Comment on the distribution. Fewer resources need to be invested in control activities in order to reduce prevention and appraisal costs. 3. Using the Taguchi loss function, an average loss per unit is computed to be $16 per unit. What are the hidden costs of external failure? How does this affect the relative distribution? A serious imbalance between control and failure costs has now been revealed, and failure costs should be decreased. 4. Shorts's quality manager decided not to bother with the hidden costs since any efforts to reduce measured external failure costs will also reduce the hidden costs. Do you agree or disagree? Disagree, since increasing control costs will not decrease hidden failure costs
Step by Step Solution
There are 3 Steps involved in it

Get step-by-step solutions from verified subject matter experts