

Question: I don't understand this assignment at all and was wondering if someone could help me out with this and explain it to me as well!
I don't understand this assignment at all and was wondering if someone could help me out with this and explain it to me as well!
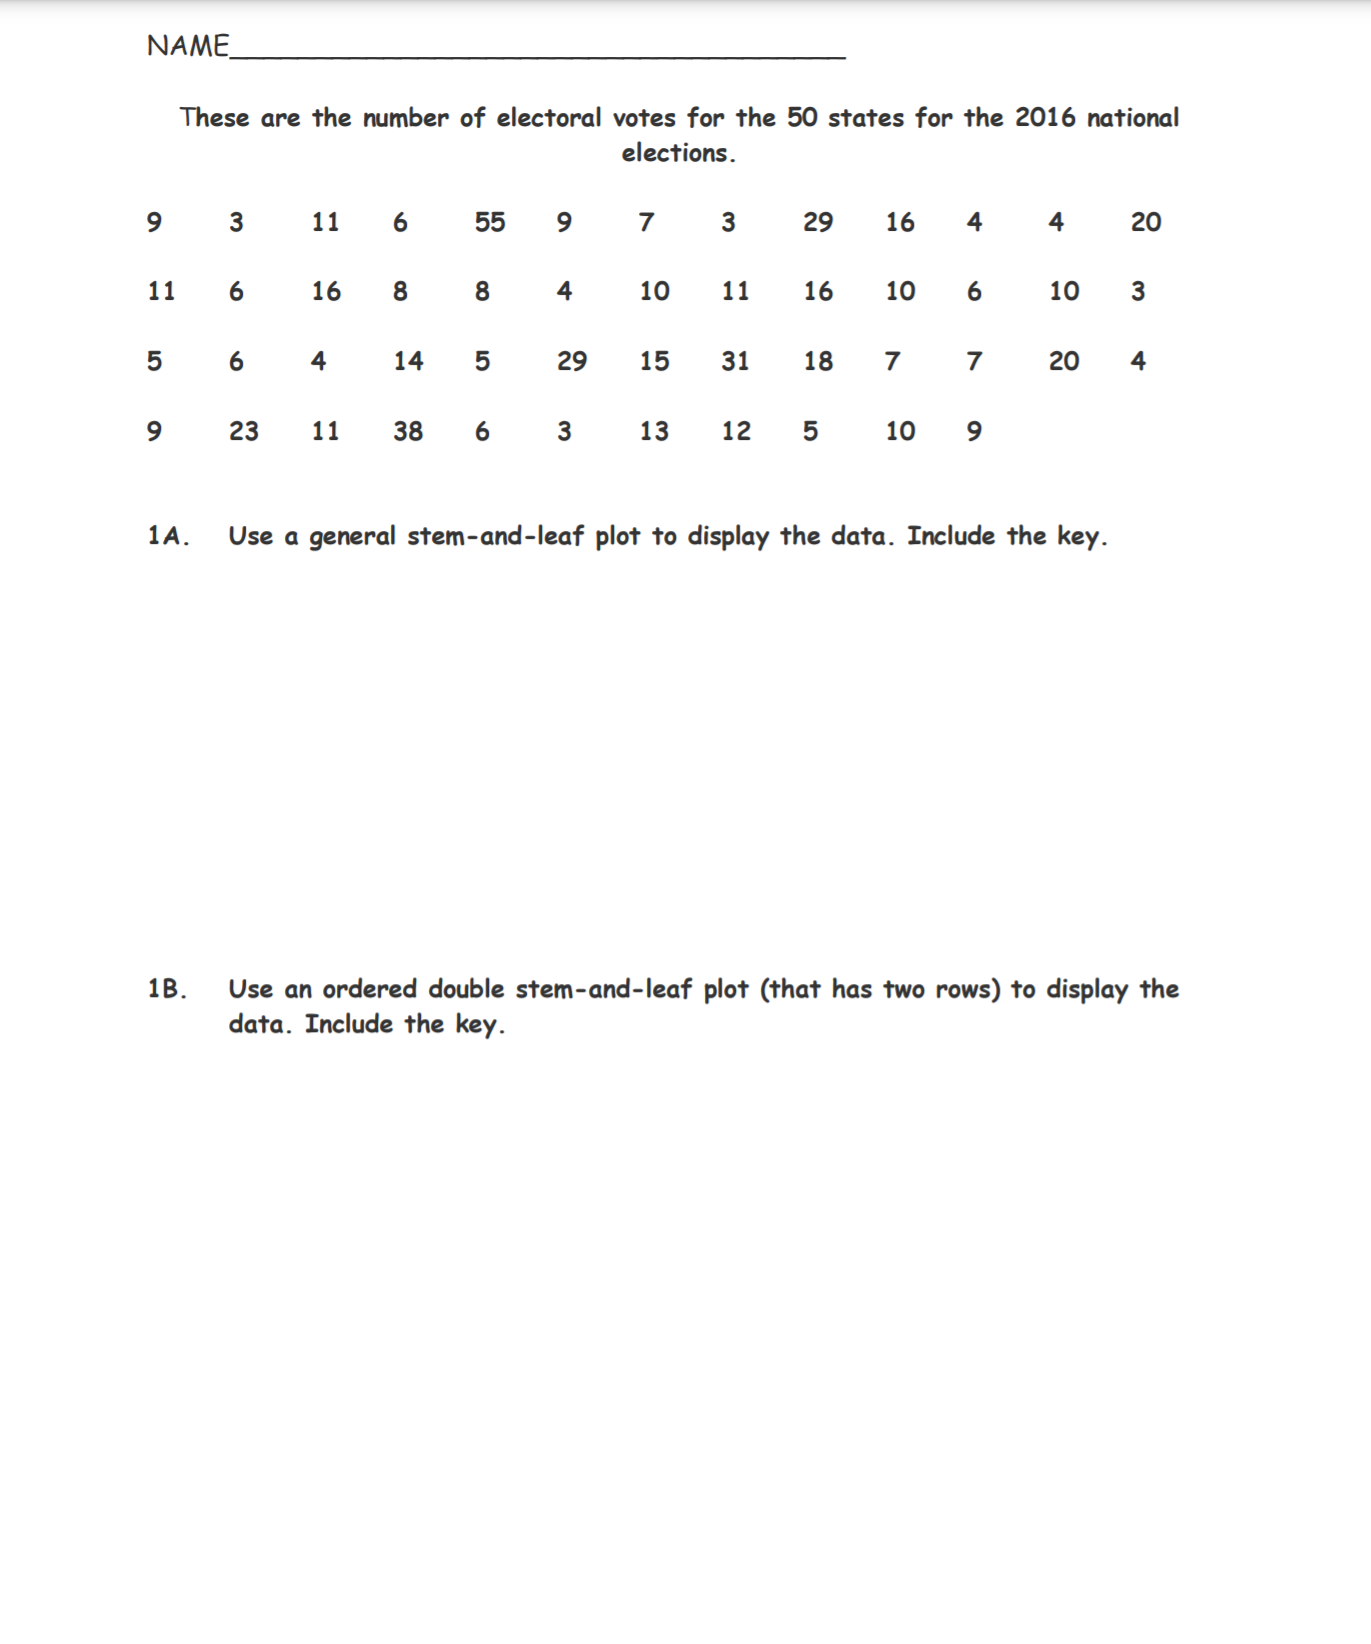
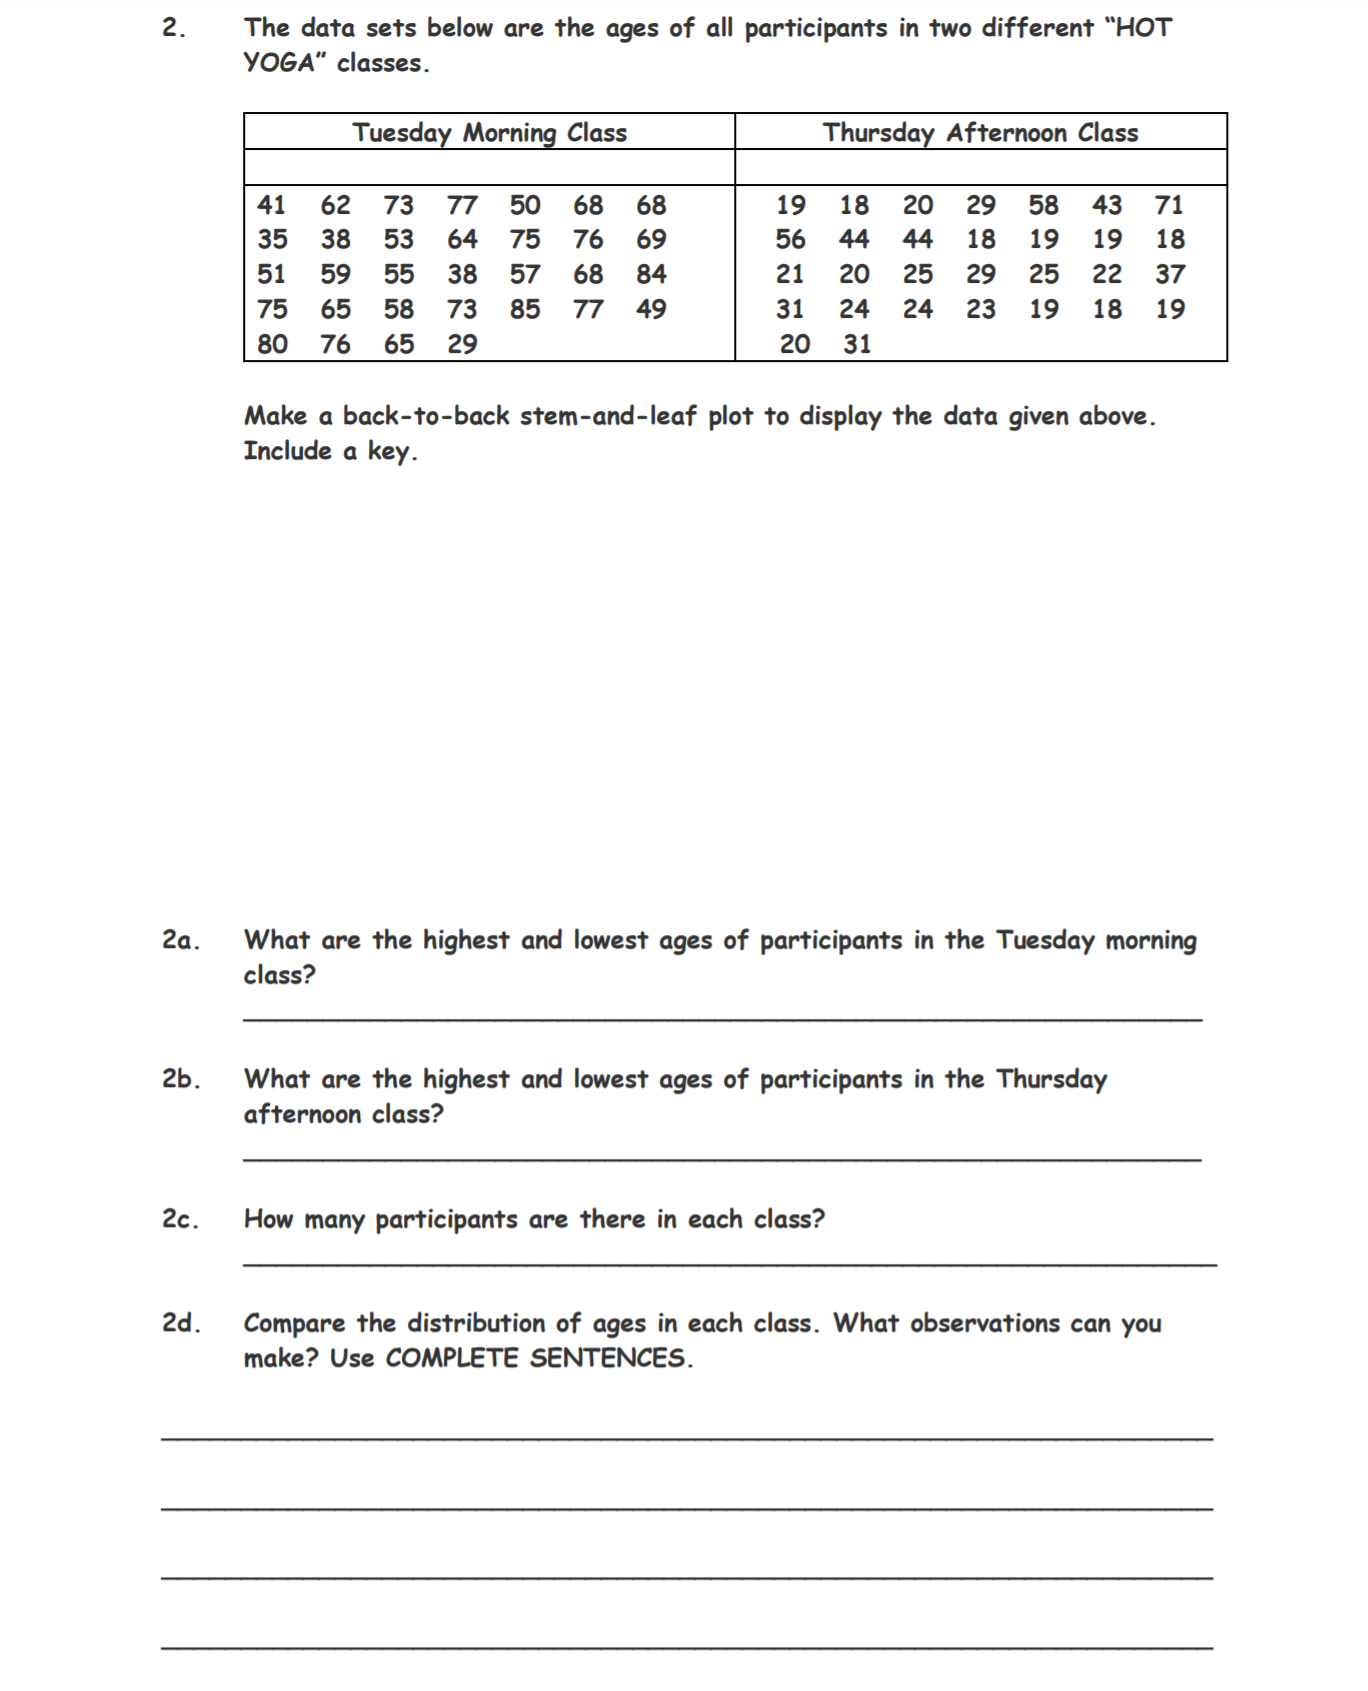
NAME These are the number of electoral votes for the 50 states for the 2016 national elections. 9 3 11 6 55 9 7 3 29 16 4 4 20 11 6 16 8 8 4 10 11 16 10 6 10 3 5 6 4 14 5 29 15 31 18 7 7 20 4 9 23 11 38 6 3 13 12 5 10 9 1A. Use a general stem-and-leat plot to display the data. Include the key. 1B. Use an ordered double stem-and-leaf plot (that has two rows) to display the data. Include the key. 2a. 2b. 2c. 2d. The data sets belowr are the ages of all participants in two different \"HOT YOGA\" classes. Tuesda Marni - Class Thursda Afternoon Class Make a back-to-back stern-and-leaf plot to display the data given above. Include a key. What are the highest and lowest ages of participants in the Tuesday morning class? What are the highest and lowest ages of participants in the Thursday afternoon class? How many participants are there in each class? Compare the distribution of ages in each class. What observations can you make? Use COMPLETE SENTENCES
Step by Step Solution
There are 3 Steps involved in it

Get step-by-step solutions from verified subject matter experts