

Question: I got table 1, please explain same request below but for table 2 instead, I only need table 2, thank you Calculate SSE, s2, and
I got table 1, please explain same request below but for table 2 instead, I only need table 2, thank you
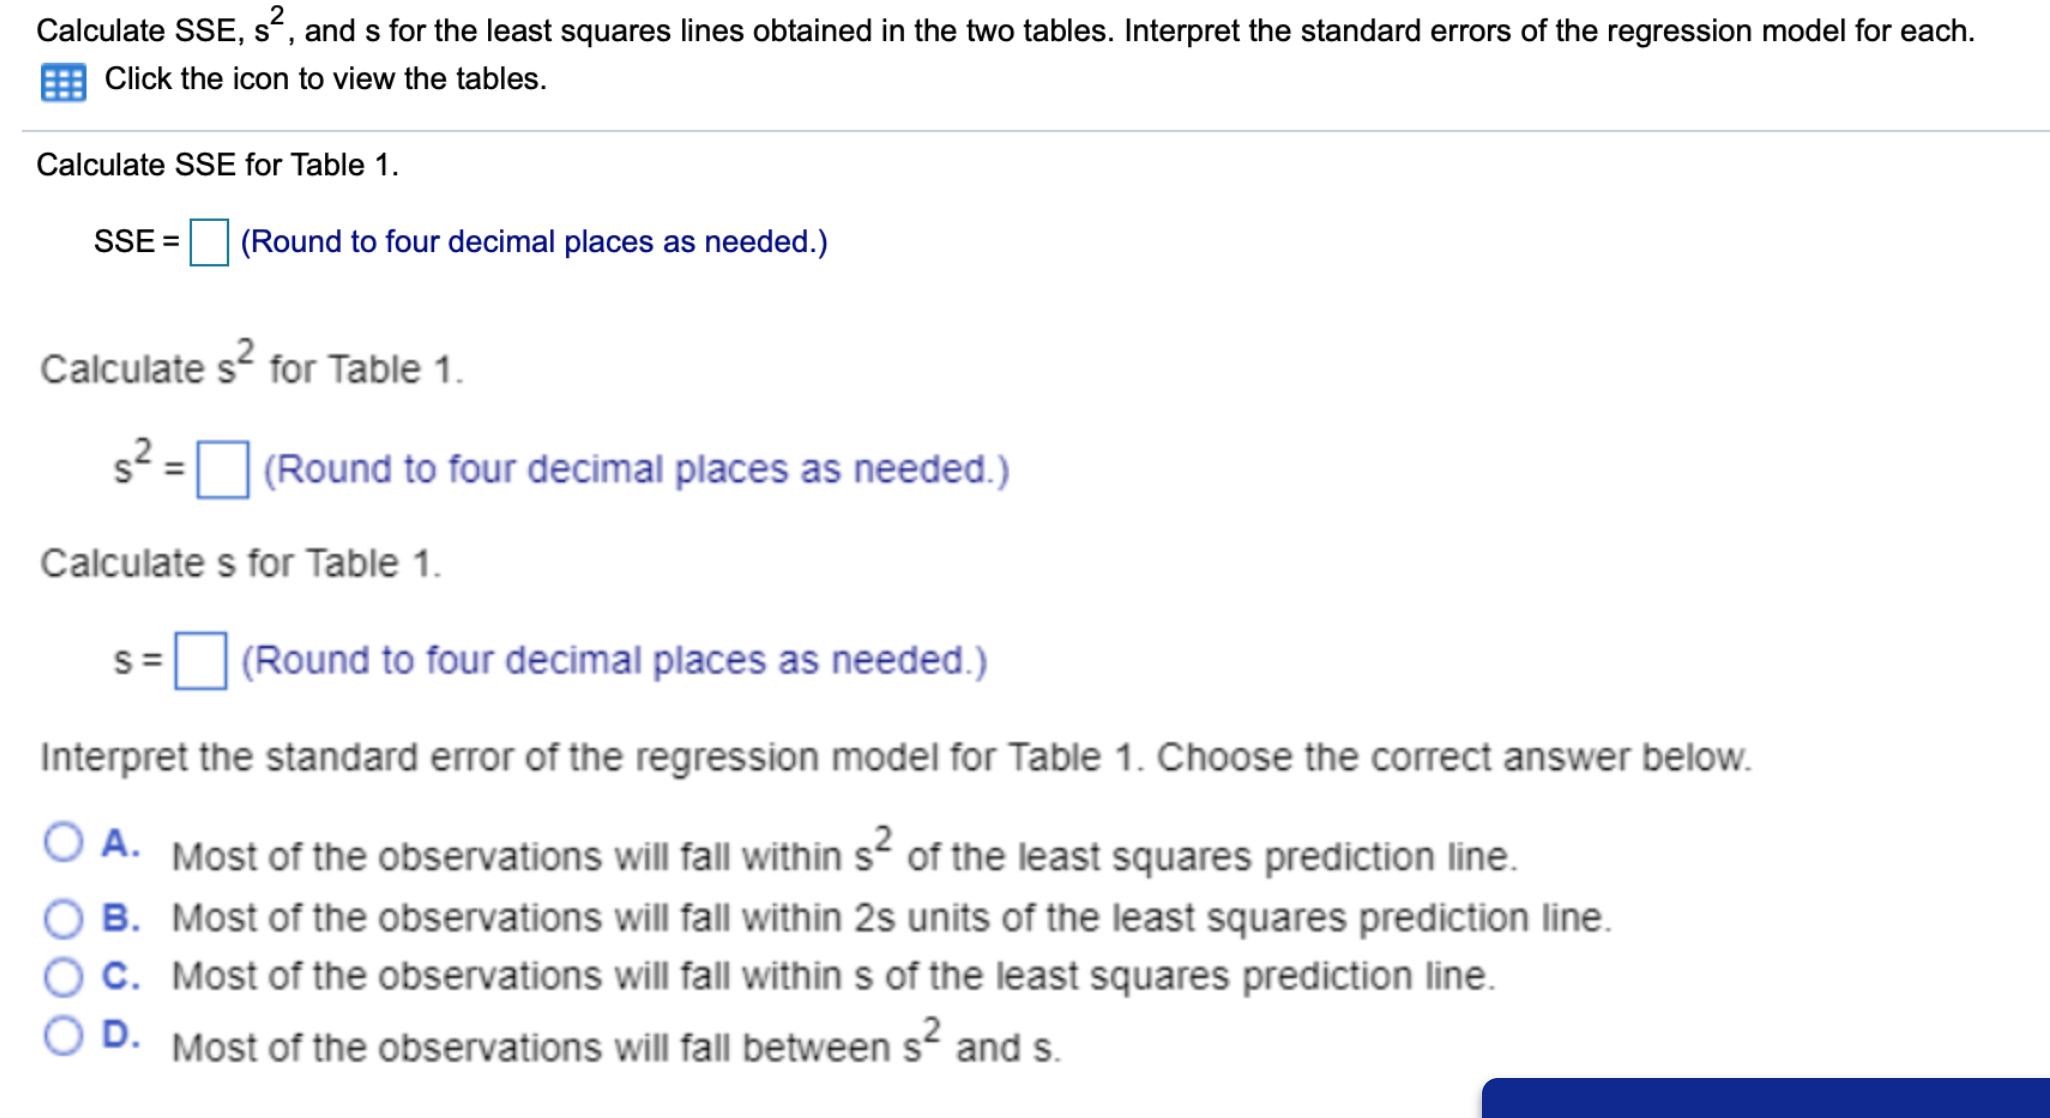
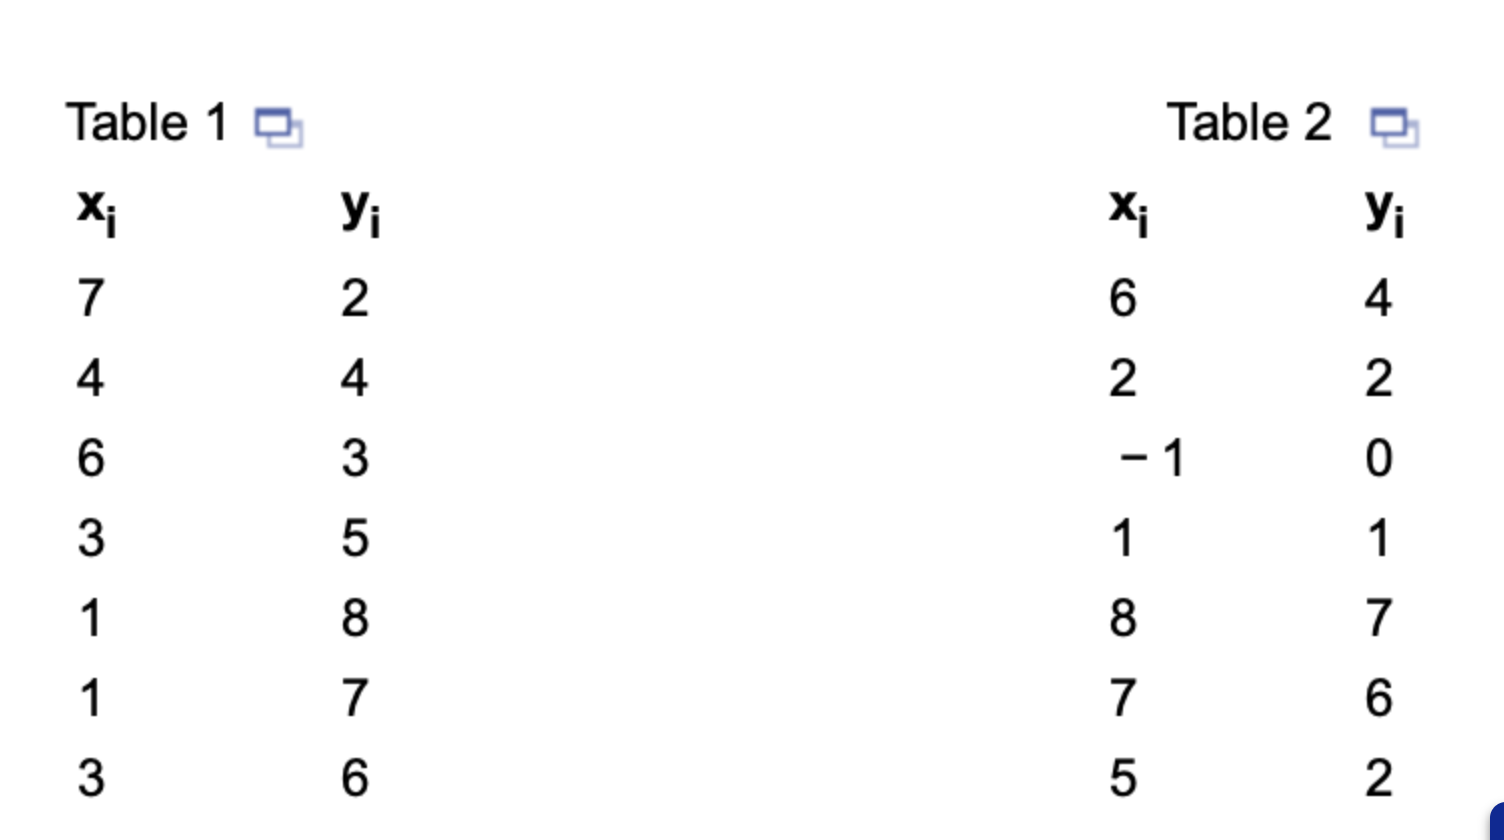
Calculate SSE, s2, and s for the least squares lines obtained in the two tables. Interpret the standard errors of the regression model for each. a Click the icon to view the tables. Calculate SSE for Table 1. SSE = D (Round to four decimal places as needed.) Calculate s2 for Table 1. $2 = D (Round to four decimal places as needed.) Calculate s for Table 1. s = |:] (Round to four decimal places as needed.) Interpret the standard error of the regression model for Table 1. Choose the correct answer below. 0 A' MOSt Of the observations Will fall within 52 0f the least squares prediction line. 0 3. Most of the observations will fall within 2s units of the least squares prediction line, 0 c. Most of the observations will fall within s of the least squares prediction line. 0 0' Most of the observations will fall between 52 and s. \f
Step by Step Solution
There are 3 Steps involved in it

Get step-by-step solutions from verified subject matter experts