Question: i got the answer wron here is the feedback. A few for you to take a closer look at: 5a: points 1-5 5b: points 5
i got the answer wron here is the feedback.
A few for you to take a closer look at: 5a: points 1-5 5b: points 5 & 6 5c: all points, 1-8 5d: points 1-7 and points 4-8 5e: Points 3, 4, 6 & 8 5f: Stable, but control limits should be reevaluated because all points are close to the mean 6a: all points, 1-9 (same trend as 5c) 6b: points 2 & 3, and all but three points above the mean 6c: points 1-5 above mean and points 6-10 below mean 6d: points (1-7) 6e: points 1 & 2 and points 7 & 8 6f: Many points close to control limits
what are the correct answers?
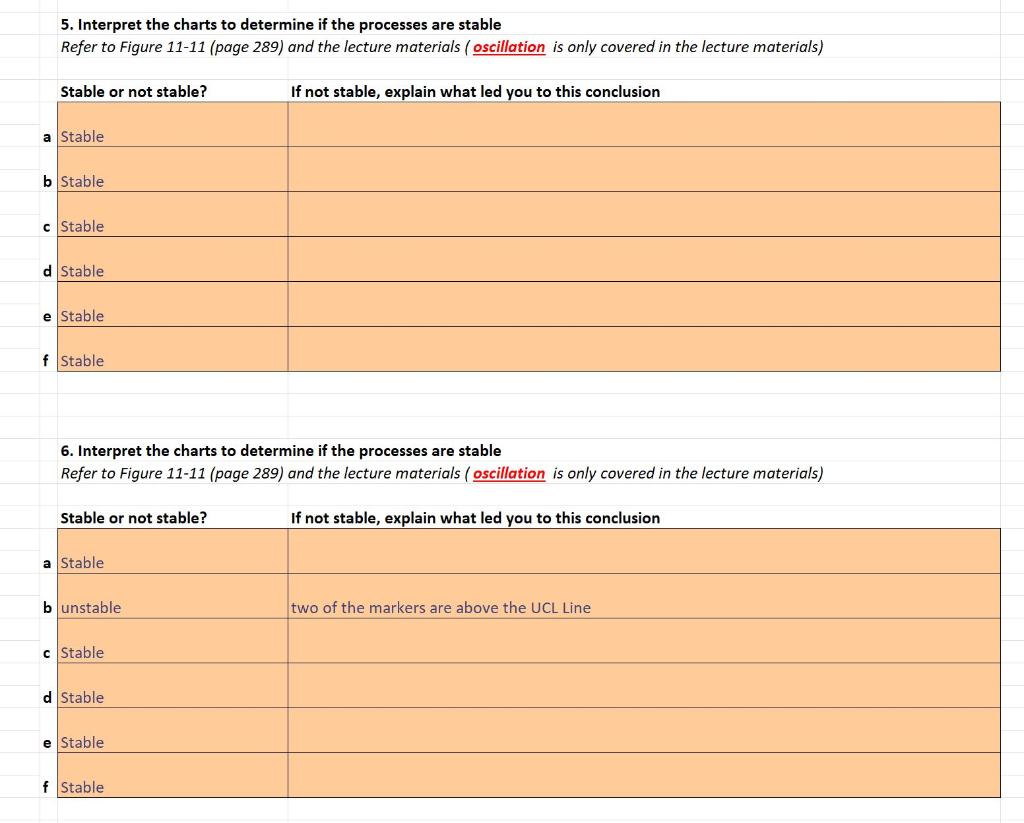
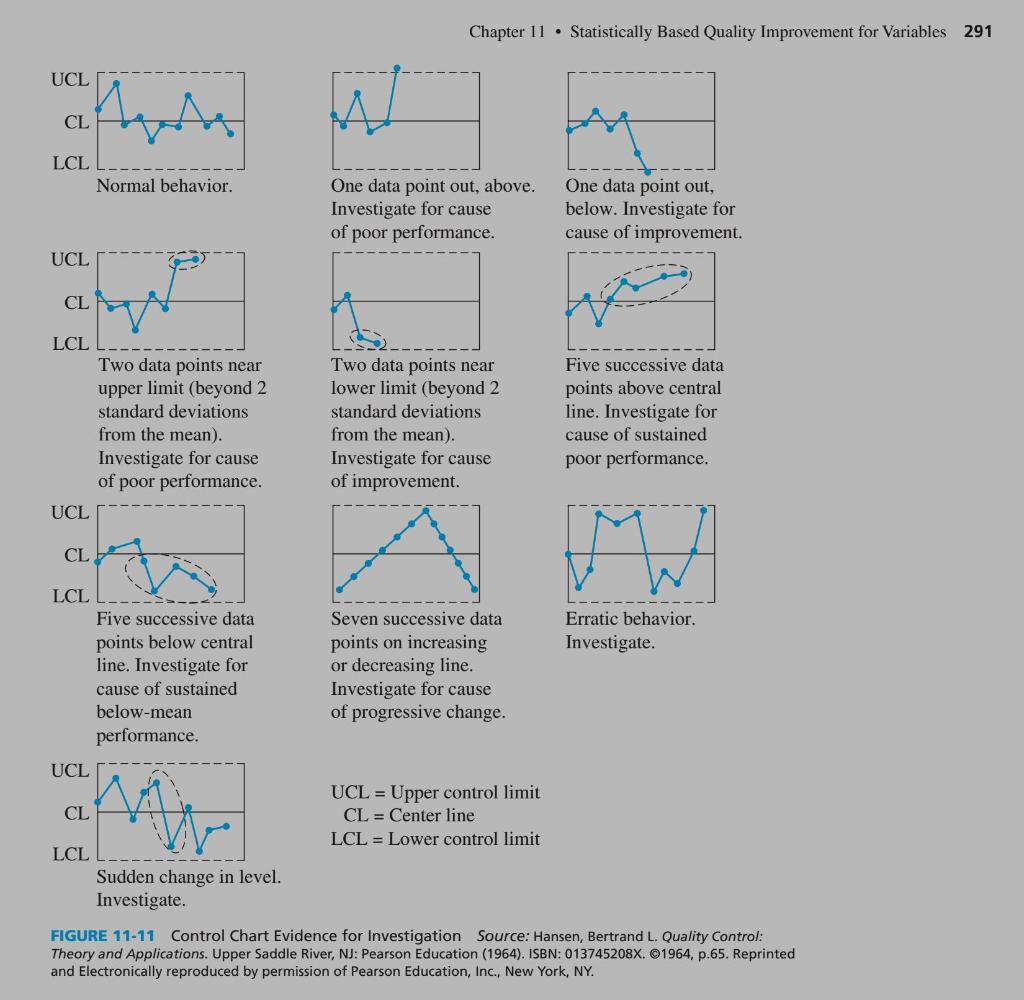
5. Interpret the charts to determine if the processes are stable Refer to Figure 11-11 (page 289) and the lecture materials ( oscillation is only covered in the lecture materials) Stable or not stable? If not stable, explain what led you to this conclusion a Stable b Stable c Stable d Stable e Stable f Stable 6. Interpret the charts to determine if the processes are stable Refer to Figure 11-11 (page 289) and the lecture materials ( oscillation is only covered in the lecture materials) Stable or not stable? If not stable, explain what led you to this conclusion a Stable b unstable two of the markers are above the UCL Line c Stable d Stable e Stable f Stable Chapter 11 Statistically Based Quality Improvement for Variables 291 UCL a Ante LCL Normal behavior. One data point out, above. Investigate for cause of poor performance. One data point out, below. Investigate for cause of improvement. UCL an CL LCL Two data points near upper limit (beyond 2 standard deviations from the mean). Investigate for cause of poor performance. UCL Two data points near lower limit (beyond 2 standard deviations from the mean). Investigate for cause of improvement Five successive data points above central line. Investigate for cause of sustained poor performance. CL LCL Erratic behavior. Investigate. Five successive data points below central line. Investigate for cause of sustained below-mean performance. Seven successive data points on increasing or decreasing line. Investigate for cause of progressive change. UCL CL M UCL = Upper control limit CL = Center line LCL = Lower control limit LCL Sudden change in level. Investigate. FIGURE 11-11 Control Chart Evidence for Investigation Source: Hansen, Bertrand L. Quality Control: Theory and Applications. Upper Saddle River, NJ: Pearson Education (1964). ISBN: 013745208X. 1964, p.65. Reprinted and Electronically reproduced by permission of Pearson Education, Inc., New York, NY. 5. Interpret the charts to determine if the processes are stable Refer to Figure 11-11 (page 289) and the lecture materials ( oscillation is only covered in the lecture materials) Stable or not stable? If not stable, explain what led you to this conclusion a Stable b Stable c Stable d Stable e Stable f Stable 6. Interpret the charts to determine if the processes are stable Refer to Figure 11-11 (page 289) and the lecture materials ( oscillation is only covered in the lecture materials) Stable or not stable? If not stable, explain what led you to this conclusion a Stable b unstable two of the markers are above the UCL Line c Stable d Stable e Stable f Stable Chapter 11 Statistically Based Quality Improvement for Variables 291 UCL a Ante LCL Normal behavior. One data point out, above. Investigate for cause of poor performance. One data point out, below. Investigate for cause of improvement. UCL an CL LCL Two data points near upper limit (beyond 2 standard deviations from the mean). Investigate for cause of poor performance. UCL Two data points near lower limit (beyond 2 standard deviations from the mean). Investigate for cause of improvement Five successive data points above central line. Investigate for cause of sustained poor performance. CL LCL Erratic behavior. Investigate. Five successive data points below central line. Investigate for cause of sustained below-mean performance. Seven successive data points on increasing or decreasing line. Investigate for cause of progressive change. UCL CL M UCL = Upper control limit CL = Center line LCL = Lower control limit LCL Sudden change in level. Investigate. FIGURE 11-11 Control Chart Evidence for Investigation Source: Hansen, Bertrand L. Quality Control: Theory and Applications. Upper Saddle River, NJ: Pearson Education (1964). ISBN: 013745208X. 1964, p.65. Reprinted and Electronically reproduced by permission of Pearson Education, Inc., New York, NY


