

Question: I got the following data from Johnson & Johnson's balance sheet and Income statement. Then, after applied the formulas I found the ratios reflected in
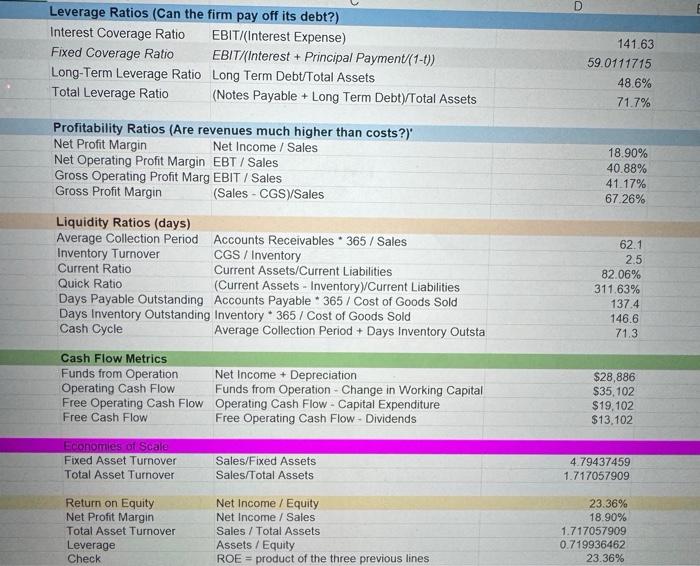
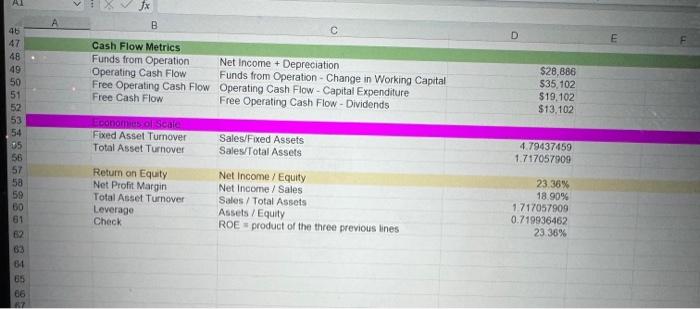
I got the following data from Johnson & Johnson's balance sheet and Income statement. Then, after applied the formulas I found the ratios reflected in the figures. How do you interpret the following radios from the company? is this company healthy or unhealthy? Can the firm pay off its debt? Are revenues more higher than the costs? Explain...
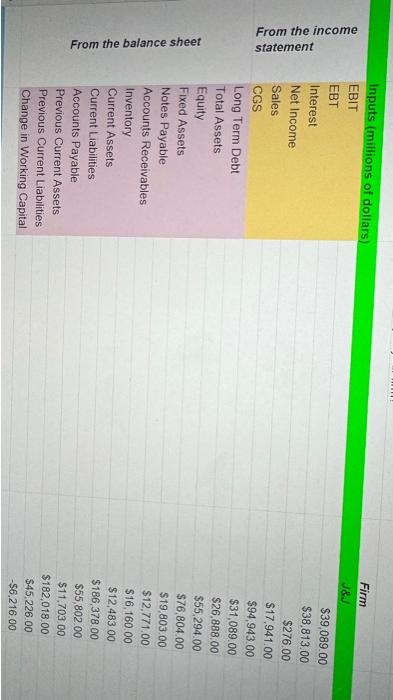
From the balance sheet From the income statement Inputs (millions of dollars) EBIT EBT Interest Net Income Sales CGS Long Term Debt Total Assets Equity Fixed Assets Notes Payable Accounts Receivables Inventory Current Assets Current Liabilities Accounts Payable Firm J&J $39,089.00 $38,813.00 $276.00 $17,941.00 $94,943.00 $31,089.00 $26,888.00 $55,294.00 $76,804.00 $19,803.00 $12,771.00 $16,160.00 $12,483.00 $186,378.00 $55,802.00 $11,703.00 Previous Current Assets Previous Current Liabilities Change in Working Capital $182,018.00 $45.226.00 -$6,216.00
Step by Step Solution
There are 3 Steps involved in it
1 Expert Approved Answer
Step: 1 Unlock

Question Has Been Solved by an Expert!
Get step-by-step solutions from verified subject matter experts
Step: 2 Unlock
Step: 3 Unlock