

Question: I have a dataset named 'SomeNumbers.csv'. I need to : Describe the data: state the size and shape of the dataset and the nature of
I have a dataset named 'SomeNumbers.csv'. I need to :
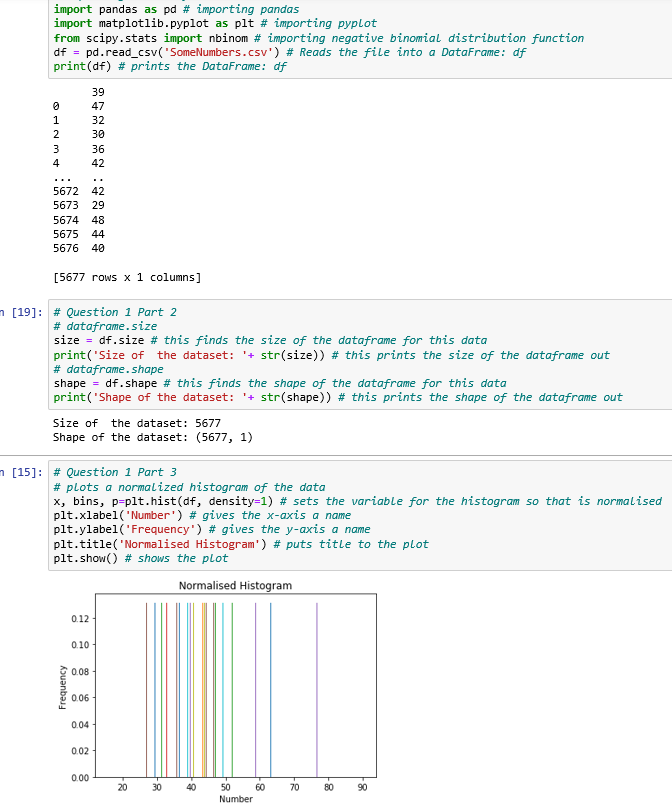
- Describe the data: state the size and shape of the dataset and the nature of the numbers enclosed.
- Plot a normalised histogram of the data.
- These data come from a Negative Binomial distribution. Write a function to compute the log-likelihood.
- The Negative Binomial distribution has two parameters, N and p. Using your code from part 3, compute the values of log-likelihood for values of N in the range [10-60] and p in the range [0-1] (e.g. use 50 values). Plot your results as a two-dimensional plot with the value of log-likelihood as the colour (or equivalently, make a contour or three dimensional plot). Comment on your results.
\f
Step by Step Solution
There are 3 Steps involved in it
1 Expert Approved Answer
Step: 1 Unlock

Question Has Been Solved by an Expert!
Get step-by-step solutions from verified subject matter experts
Step: 2 Unlock
Step: 3 Unlock