

Question: need help with these questions please. My code done so far is above. And I have to do these questions: Question 1 Find the best-fit
need help with these questions please.
My code done so far is above. And I have to do these questions:
Question 1
Find the best-fit distribution using Maximum Likelihood Estimation (MLE).
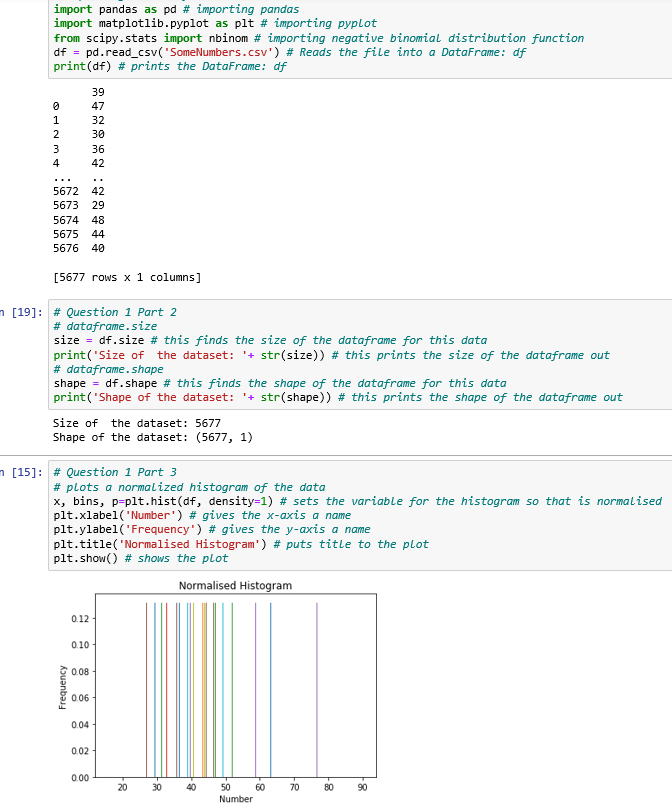
- Import the data from the file 'SomeNumbers.csv'.
- Describe the data: state the size and shape of the dataset and the nature of the numbers enclosed.
- Plot a normalised histogram of the data.
- These data come from a Negative Binomial distribution. Write a function to compute the log-likelihood. You can let log(0) = 0 if required.
- The Negative Binomial distribution has two parameters, N and p. Using your code from part 4, compute the values of log-likelihood for values of N in the range [10-60] and p in the range [0-1] (e.g. use 50 values). Plot your results as a two-dimensional plot with the value of log-likelihood as the colour (or equivalently, make a contour or three dimensional plot). Ensure you comment on the results.
- Compute the maximum of the log-likelihood and find the best-fit values of N and p. Make a plot of the best-fit distribution on top of the histogram from part 3. Comment on your results.
The code I have done so far is below:
\f
Step by Step Solution
There are 3 Steps involved in it
1 Expert Approved Answer
Step: 1 Unlock

Question Has Been Solved by an Expert!
Get step-by-step solutions from verified subject matter experts
Step: 2 Unlock
Step: 3 Unlock