

Question: I have a question regarding NFP ratios? Use 2018 Form 990 and the 2019 audited financial statements for Feeding America. Although Form 990 indicates it
I have a question regarding NFP ratios?
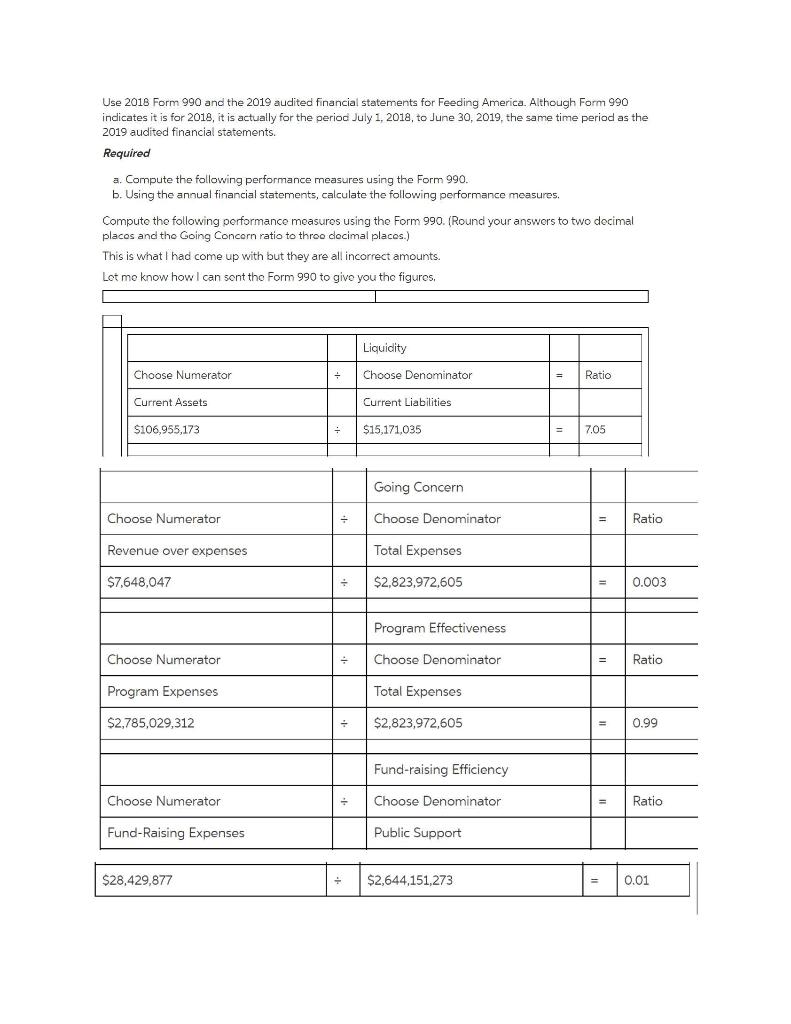
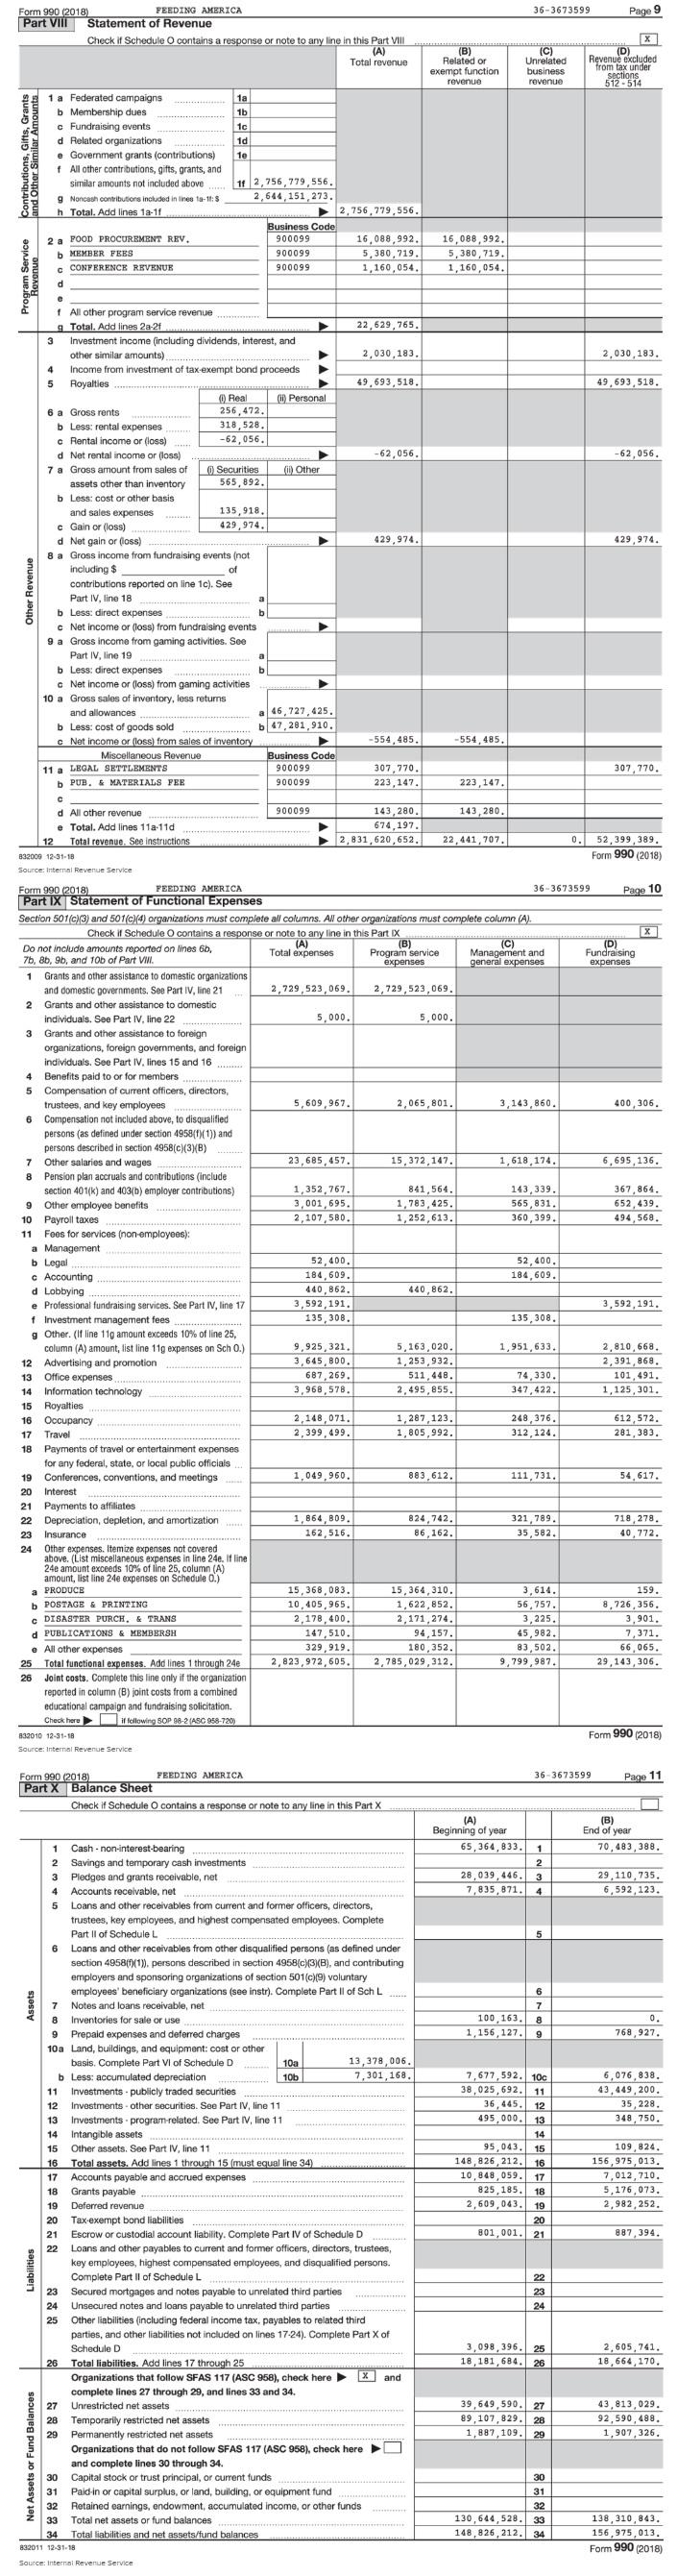
Use 2018 Form 990 and the 2019 audited financial statements for Feeding America. Although Form 990 indicates it is for 2018, it is actually for the period July 1, 2018, to June 30, 2019, the same time period as the 2019 audited financial statements. Required a. Compute the following performance measures using the Form 990. b. Using the annual financial statements, calculate the following performance measures. Compute the following performance measures using the Form 990. (Round your answers to two decimal places and the Going Concern ratio to three decimal places.) This is what I had come up with but they are all incorrect amounts. Let me know how I can sent the Form 990 to give you the figures. Liquidity Choose Numerator - Choose Denominator = Ratio Current Assets Current Liabilities $106,955,173 - $15,171,035 - 7.05 Going Concern Choose Numerator - Choose Denominator Ratio Revenue over expenses Total Expenses $7,648,047 $2,823,972,605 0.003 Program Effectiveness Choose Numerator . Choose Denominator Ratio Program Expenses Total Expenses $2,785,029,312 - $2,823,972,605 = 0.99 Fund-raising Efficiency Choose Numerator Choose Denominator = Ratio Fund-Raising Expenses Public Support $28,429,877 $2,644,151,273 = 0.01 36-3673599 Page 9 Form 990 (2018) FEEDING AMERICA Part VIII Statement of Revenue Check if Schedule O contains a response or note to any line in this Part VIII (A) Total revenue Related or exempt function revenue IC) Unrelated business revenue x (D) Revenue excluded from tax under sections 512.514 1 a Federated campaigns b Membership dues c Fundraising events d Related organizations e Government grants (contributions) f All other contributions, gifts, grants, and similar amounts not included above g Noncash contributions included in tinesta-16: $ h Total. Add lines 12-1f 1a 1b 1c 1d 1e Contributions, Gifts 11 2,756,779,556. 2,644, 151,273. 2.756,779,556. Business Code 900099 16,088,992. 900099 5,380,719. 900099 1,160,054 2 a FOOD PROCUREMENT REV. b MEMBER FEES CONFERENCE REVENUE 16,088,992. 5,380,719. 1,160,054. d 22,629,765 2,030,183 2,030,183. 49,693,518. 49,693,518. -62,056. -62,056 429,974. 429,974. 1 All other program service revenue 9 Total. Add lines 2a-2f 3 Investment income (including dividends, interest, and other similar amounts) 4 Income from investment of tax-exempt bond proceeds 5 Royalties ) Real () Personal 6 a Gross rents 256, 472. b Less: rental expenses 318 528 Rental income or loss) -62,056. d Net rental income or (loss) 7 a Gross amount from sales of Securities l) Other assets other than inventory 565, 892. b Less: cost or other basis and sales expenses 135,918. c Gain or loss) 429,974. d Net gain or loss) 8 a Gross income from fundraising events (not including $ of contributions reported on line 1c). See Part IV, line 18 b Less: direct expenses c Net income or (loss) from fundraising events 9 a Gross income from gaming activities. See Part IV, line 19 b Less: direct expenses Net Income or (loss) from gaming activities 10 a Gross sales of inventory, less returns and allowances a 46,727,425. b Less: cost of goods sold b 47,281,910. c Net income or loss from sales of inventory Miscellaneous Revenue Business Code 11 a LEGAL SETTLEMENTS 900099 b PUB. & MATERIALS FEE 900099 Other Revenue -554, 485. -554, 485 307,770. 307,770. 223, 147 223, 147 900099 143,280. 143,280. 674, 197, d All other revenue e Total. Add lines 11a-11d Total revenue. See instructions 832009 12-31-18 Source: Internal Revenue Service 2,831,620, 652. 22,441,707. 0 52,399,389. Form 990 (2018) genere Form 990 (2018) FEEDING AMERICA 36-3673599 Page 10 Part IX Statement of Functional Expenses Section 501(c)(3) and 501(cX4) organizations must complete all columns. Al other organizations must complete column (A). Check if Schedule o contains a response or note to any line in this part IX X (A) (B) (c) Do not include amounts reported on lines 6b, (D) Total expenses Program service 75, 86, 9b, and 10b of Part VII. Management and Fundraising expenses expenses expenses Grants and other assistance to domestic organizations and domestic governments. See Part IV, line 21 2,729,523,069 2,729,523,069 2 Grants and other assistance to domestic individuals. See Part IV, line 22 5,000 5.000. 3 Grants and other assistance to foreign organizations, foreign governments, and foreign individuals. See Part IV. lines 15 and 16 4 Benefits paid to or for members 5 Compensation of current officers, directors, trustees, and key employees 5,609,967. 2,065,801. 3,143,860. 400,306. 6 Compensation not included above, to disqualified persons (as defined under Section 49581)(1)) and persons described in section 4958(c)(3B) Other salaries and wages 23,685,457. 15,372,147. 1,618,174. 6,695, 136, 8 Pension plan accruals and contributions (include Section 401(k) and 403(b) employer contributions) 1,352,767. 841,564 143,339 367,864 9 Other employee benefits 3,001,695. 1,783,425 565,831 652, 439. 10 Payroll taxes 2,107,530 1, 252,613 360 399, 494,568. 11 Foes for services (non-employees): a Management b Legal 52,400. 52,400 c Accounting 184,609. 184,609. d Lobbying 440,862. 440,862. e Professional fundraising services. See Part IV, line 17 3,592,191. 3,592,191. f Investment management fees 135,308. 135, 308. g Other. (I 11 amount exceeds 10% of line 25, column (A) amount, list line 11g expenses on Sch O.) 9,925,321 5, 163,020. 1,951,633 2,810,668. 12 Advertising and promotion 3,645,800. 1,253,932 2,391,868. 13 Office expenses 687, 269. 511,448 74,330 101,491. 14 Information technology 3,968,578 2,495,855. 347,422 1,125,301. 15 Royalties 16 Occupancy 2,148,071. 1,287,123. 248,376 612,572. 17 Travel 2,399, 499. 1,805,992. 312,124. 281,383. 18 Payments of travel or entertainment expenses for any federal, state, or local public officials 19 Conferences, conventions, and meetings 1.049,960. 883, 612 111,731. 54.617. 20 Interest 21 Payments to affiliates 22 Depreciation, depletion, and amortization 1,864, 309. 824,742. 321,789. 718,278. 23 Insurance 162,516. 86,162 35,582. 40,772. 24 Other expenses. Itemize expenses not covered above. (List miscellaneous expenses in line 24e. If line 24e amount exceeds 10% of line 25, column (A) amount, list line 24e expenses on Schedule 0.) a PRODUCE 15,368,083. 15,364,310. 3,614 159. b POSTAGE & PRINTING 10,405,965. 1,622,852. 56.757 8.726,356 C DISASTER PURCH & TRANS 2,178,400. 2,171,274, 3,225. 3,901. d PUBLICATIONS & MEMBERSH 147.510 94,157. 45,982. 7,371. e All other expenses 329.919 180.352. 83,502 66,065. 25 Total functional expenses. Add lines 1 through 24e 2,823,972,605. 2,785,029,312. 9,799,987. 29, 143, 306. 26 Joint costs. Complete this line only if the organization reported in column (B) joint costs from a combined educational campaign and fundraising solicitation Check here following SOP 98-2/ASC 958-720) 832010 12-31-18 Form 990 (2018) Source: Internal Revenue Service n 36-3673599 Page 11 Form 990 (2018) FEEDING AMERICA Part X Balance Sheet Check if Schedule o contains a response or note to any line in this part X (A) Beginning of year 65 364.833, (B) End of year 70,483,388. 28,039, 446 7,835,871. 1 2 3 4 29, 110,735. 6,592, 123. 5 100 163, 1,156,127. 6 7 8 9 0. 768,927. 6,076,838. 43, 449,200. 35,228. 348,750. 1 Cash -non-interest-bearing 2 Savings and temporary cash investments 3 Pledges and grants receivable, net 4 Accounts receivable, net... 5 Loans and other receivables from current and former officers, directors, trustees, key employees, and highest compensated employees. Complete Part II of Schedule L 6 Loans and other receivables from other disqualified persons (as defined under Section 4958((1)), persons described in section 4958(c)(3)(B), and contributing employers and sponsoring organizations of section 501(c)(9) voluntary employees' beneficiary organizations (see instr). Complete Part II of Sch L 7 Notes and loans receivable, net 8 Inventories for sale or use 9 Prepaid expenses and deferred charges 10a Land, buildings, and equipment: cost or other basis. Complete Part VI of Schedule D 10a 13,378,006. b Less: accumulated depreciation 10b 7,301 168. 11 Investments publicly traded securities 12 Investments - other securities. See Part IV, line 11 13 Investments. program related. See Part IV, line 11 14 Intangible assets 15 Other assets. See Part IV, line 11 16 Total assets. Add lines 1 through 15 (must equal line 34 17 Accounts payable and accrued expenses 18 Grants payable 19 Deferred revenue 20 Tax-exempt bond liabilities 21 Escrow or custodial account liability. Complete Part IV of Schedule D 22 Loans and other payables to current and former officers, directors, trustees, key employees, highest compensated employees, and disqualified persons. Complete Part II of ScheduleL 23 Secured mortgages and notes payable to unrelated third parties 24 Unsecured notes and loans payable to unrelated third parties 25 Other liabilities (including federal income tax, payables to related third parties, and other liabilities not included on lines 17-24). Complete Part X of Schedule D 26 Total liabilities. Add lines 17 through 25 Organizations that follow SFAS 117 (ASC 958), check here X and complete lines 27 through 29, and lines 33 and 34. 27 Unrestricted net assets 28 Temporarily restricted net assets 29 Permanently restricted net assets Organizations that do not follow SFAS 117 (ASC 958), check here and complete lines 30 through 34. 30 Capital stock or trust principal, or current funds 31 Paid in or capital surplus, or land, building, or equipment fund 32 Retained earnings, endowment, accumulated income, or other funds 33 Total net assets or fund balances 34 Total liabilities and net assets/fund balances 892011 12-01-18 Source: Internal Revenue Service 7,677,592. 10c 38,025,692. 11 36,445 12 495,000 13 14 95,043 15 148,826, 212, 16 10,848,059 17 825, 185, 18 2,609,043 19 20 801,001. 21 109,824. 156,975,013. 7,012,710 5,176,073. 2,982,252. 887,394. Liabilities 22 23 24 3,098, 396. 18,181,684. 25 26 2,605,741. 18, 664,170. 39,649,590.27 89,107,829. 28 1,887,109. 29 43,813,029. 92,590, 488. 1,907,326. Net Assets or Fund Balances 30 31 32 33 34 130,644,528. 148,826, 212. 138, 310,843. 156,975,013. Form 990 (2018)
Step by Step Solution
There are 3 Steps involved in it

Get step-by-step solutions from verified subject matter experts