

Question: I have attached the apendix that have the instructions about rounding numbers and a picture of the question. Please use Excel whenever instructed to use
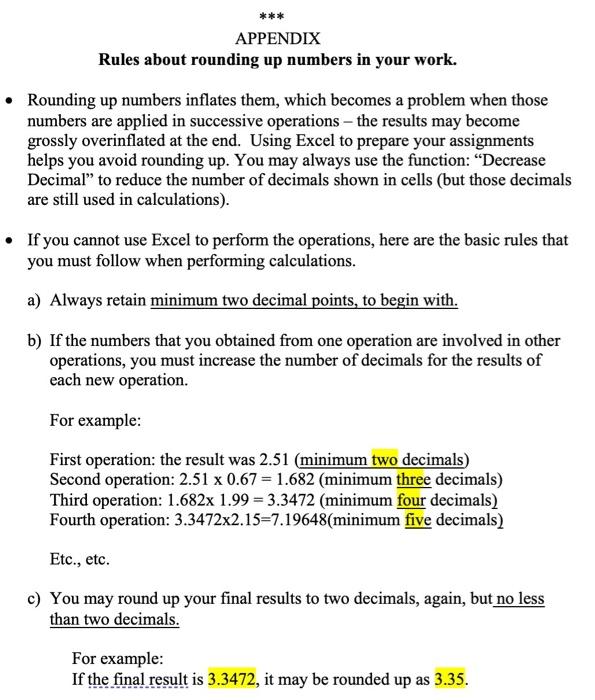
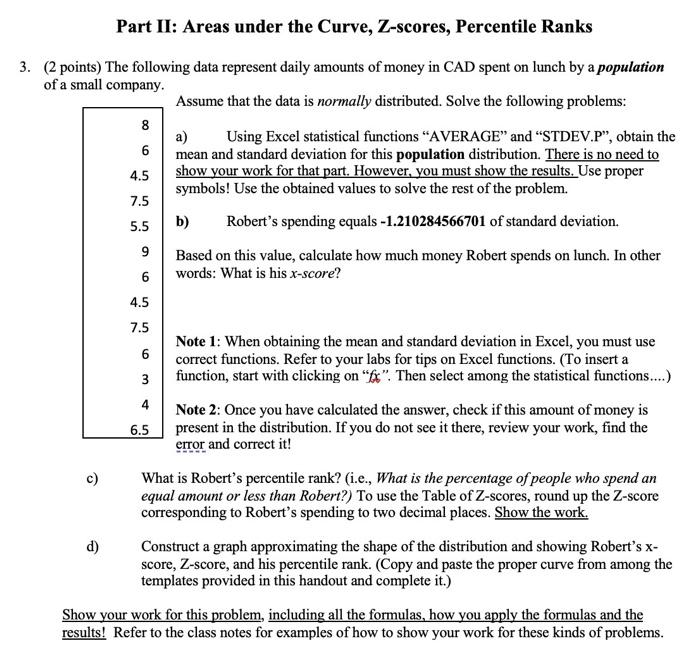
*** APPENDIX Rules about rounding up numbers in your work. Rounding up numbers inflates them, which becomes a problem when those numbers are applied in successive operations - the results may become grossly overinflated at the end. Using Excel to prepare your assignments helps you avoid rounding up. You may always use the function: Decrease Decimal to reduce the number of decimals shown in cells (but those decimals are still used in calculations). If you cannot use Excel to perform the operations, here are the basic rules that you must follow when performing calculations. a) Always retain minimum two decimal points, to begin with. b) If the numbers that you obtained from one operation are involved in other operations, you must increase the number of decimals for the results of each new operation. For example: First operation: the result was 2.51 (minimum two decimals) Second operation: 2.51 x 0.67 = 1.682 (minimum three decimals) Third operation: 1.682x 1.99 = 3.3472 (minimum four decimals) Fourth operation: 3.3472x2.15=7.19648(minimum five decimals) Etc., etc. c) You may round up your final results to two decimals, again, but no less than two decimals. For example: If the final result is 3.3472, it may be rounded up as 3.35. Part II: Areas under the Curve, Z-scores, Percentile Ranks 8 3. (2 points) The following data represent daily amounts of money in CAD spent on lunch by a population of a small company. Assume that the data is normally distributed. Solve the following problems: 8 a) Using Excel statistical functions "AVERAGE and STDEV.P, obtain the 6 mean and standard deviation for this population distribution. There is no need to 4.5 show your work for that part. However, you must show the results. Use proper symbols! Use the obtained values to solve the rest of the problem. 7.5 5.5 b) Robert's spending equals -1.210284566701 of standard deviation. 9 Based on this value, calculate how much money Robert spends on lunch. In other 6 words: What is his x-score? 4.5 7.5 Note 1: When obtaining the mean and standard deviation in Excel, you must use 6 correct functions. Refer to your labs for tips on Excel functions. (To insert a 3 function, start with clicking on "x". Then select among the statistical functions....) 4 Note 2: Once you have calculated the answer, check if this amount of money is 6.5 present in the distribution. If you do not see it there, review your work, find the error and correct it! 4 c) What is Robert's percentile rank? (i.e., What is the percentage of people who spend an equal amount or less than Robert?) To use the Table of Z-scores, round up the Z-score corresponding to Robert's spending to two decimal places. Show the work. d) Construct a graph approximating the shape of the distribution and showing Robert's X- score, Z-score, and his percentile rank. (Copy and paste the proper curve from among the templates provided in this handout and complete it.) Show your work for this problem, including all the formulas, how you apply the formulas and the results! Refer to the class notes for examples of how to show your work for these kinds of problems
Step by Step Solution
There are 3 Steps involved in it

Get step-by-step solutions from verified subject matter experts