

Question: I have attached the apendix that have the instructions about rounding numbers and a picture of the question. Please use Excel whenever instructed to use
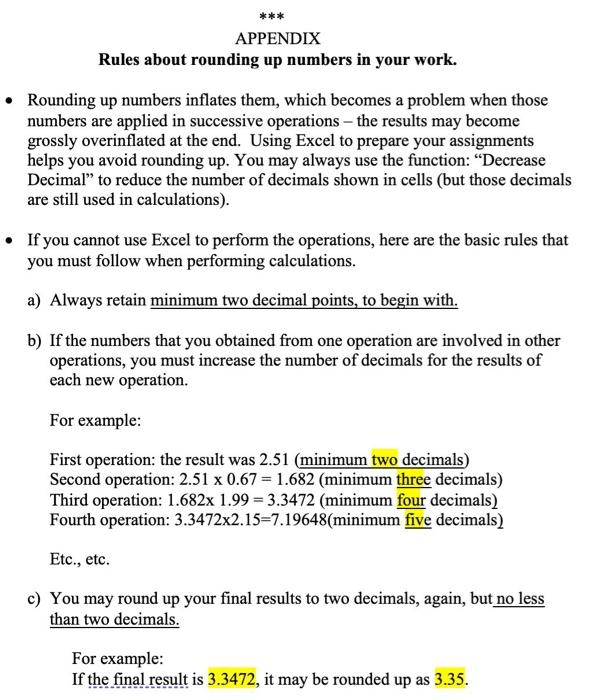
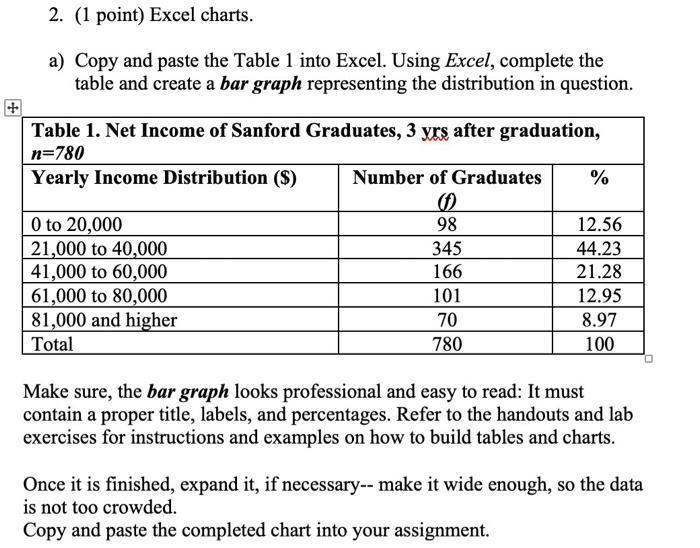
*** APPENDIX Rules about rounding up numbers in your work. Rounding up numbers inflates them, which becomes a problem when those numbers are applied in successive operations - the results may become grossly overinflated at the end. Using Excel to prepare your assignments helps you avoid rounding up. You may always use the function: Decrease Decimal to reduce the number of decimals shown in cells (but those decimals are still used in calculations). If you cannot use Excel to perform the operations, here are the basic rules that you must follow when performing calculations. a) Always retain minimum two decimal points, to begin with. b) If the numbers that you obtained from one operation are involved in other operations, you must increase the number of decimals for the results of each new operation. For example: First operation: the result was 2.51 (minimum two decimals) Second operation: 2.51 x 0.67 = 1.682 (minimum three decimals) Third operation: 1.682x 1.99 = 3.3472 (minimum four decimals) Fourth operation: 3.3472x2.15=7.19648(minimum five decimals) Etc., etc. c) You may round up your final results to two decimals, again, but no less than two decimals. For example: If the final result is 3.3472, it may be rounded up as 3.35. 2. (1 point) Excel charts. a) Copy and paste the Table 1 into Excel. Using Excel, complete the table and create a bar graph representing the distribution in question. Table 1. Net Income of Sanford Graduates, 3 yrs after graduation, n=780 Yearly Income Distribution (S) Number of Graduates % 0 to 20,000 21,000 to 40,000 41,000 to 60,000 61,000 to 80,000 81,000 and higher Total 98 345 166 101 70 780 12.56 44.23 21.28 12.95 8.97 100 Make sure, the bar graph looks professional and easy to read: It must contain a proper title, labels, and percentages. Refer to the handouts and lab exercises for instructions and examples on how to build tables and charts. Once it is finished, expand it, if necessary-- make it wide enough, so the data is not too crowded. Copy and paste the completed chart into your assignment
Step by Step Solution
There are 3 Steps involved in it

Get step-by-step solutions from verified subject matter experts