

Question: I have attached the question I need help with. I answered most of it just want to check my work fAn employee at a coffee
I have attached the question I need help with. I answered most of it just want to check my work
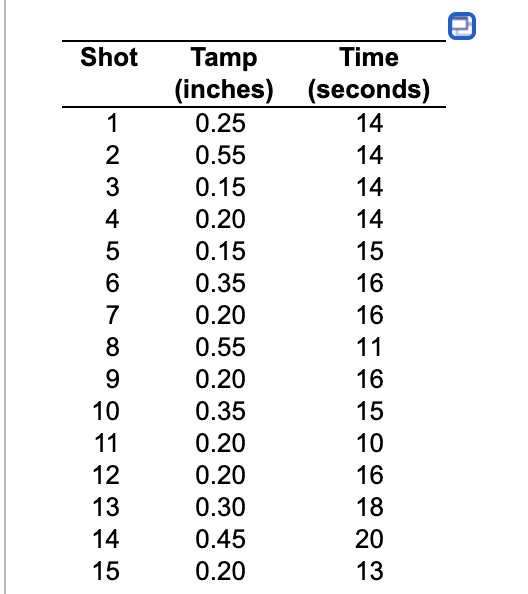

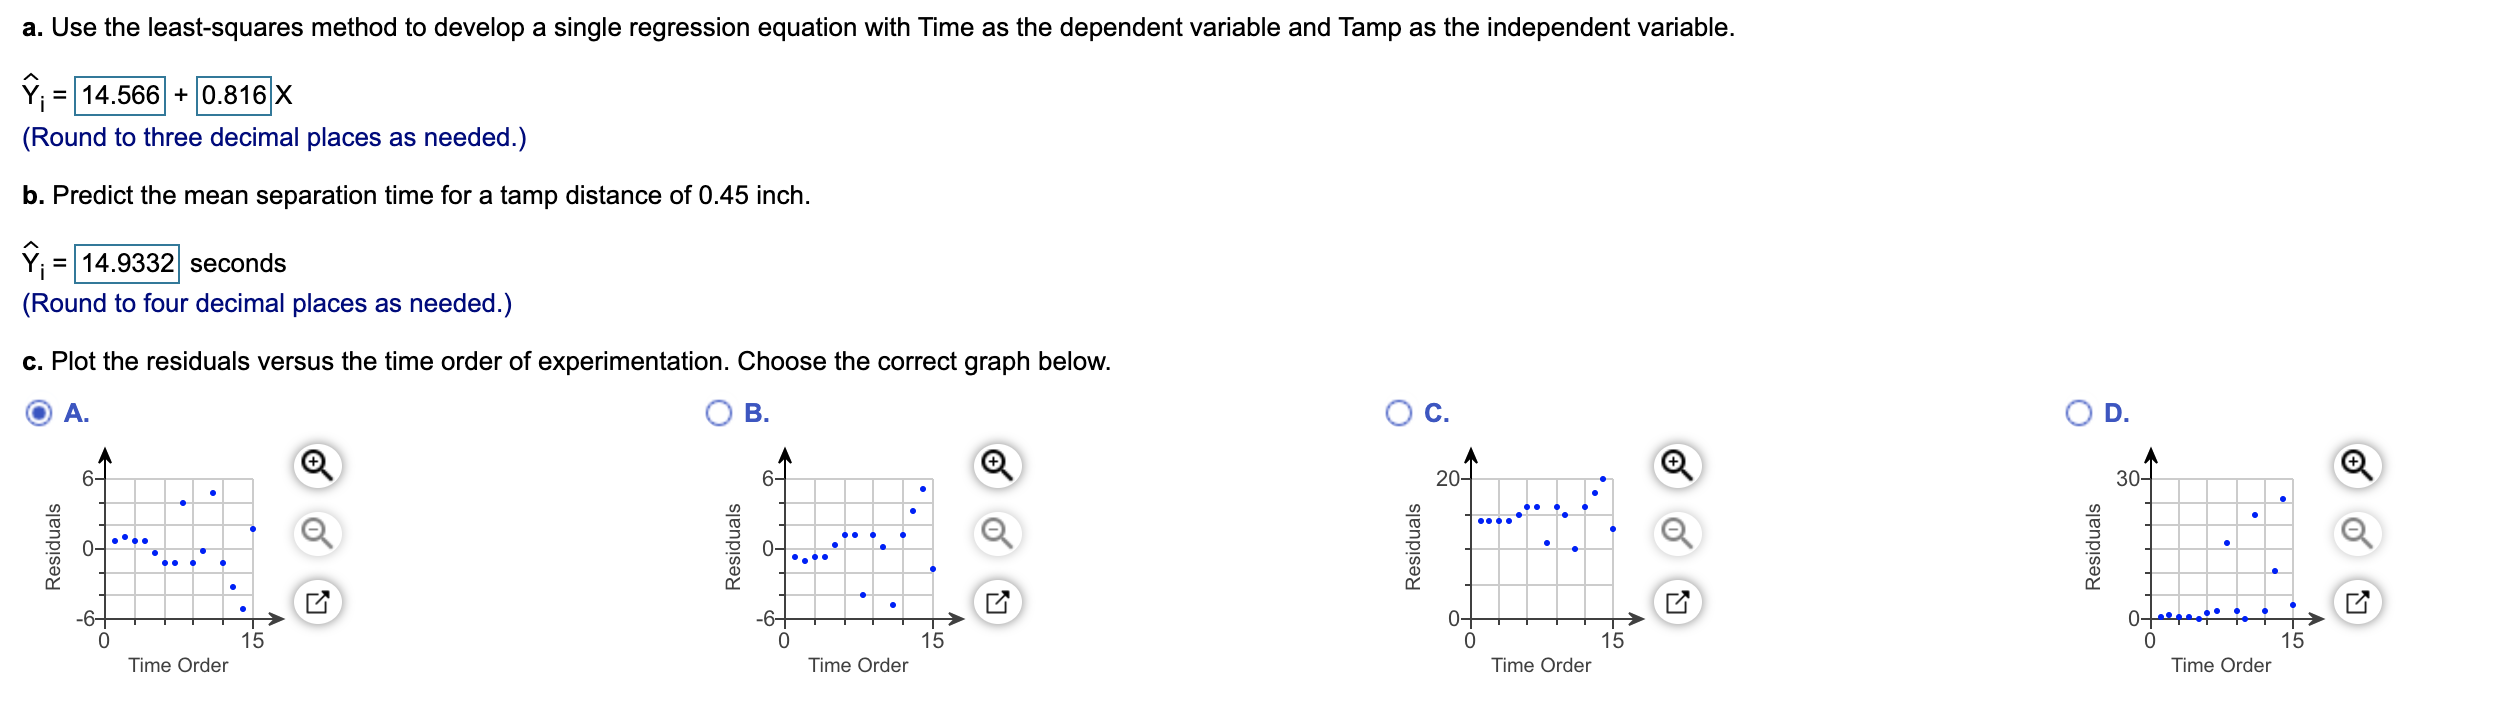
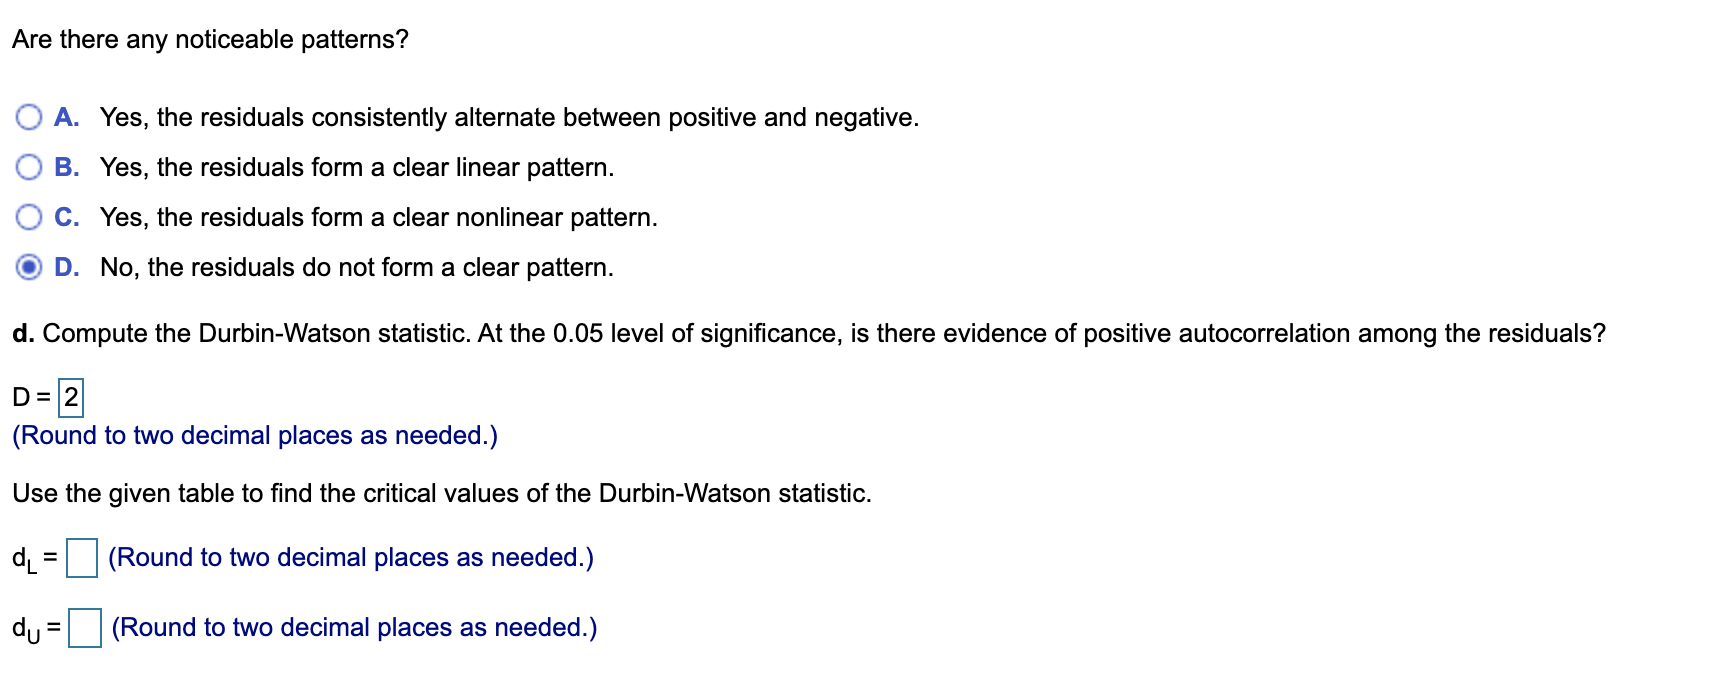
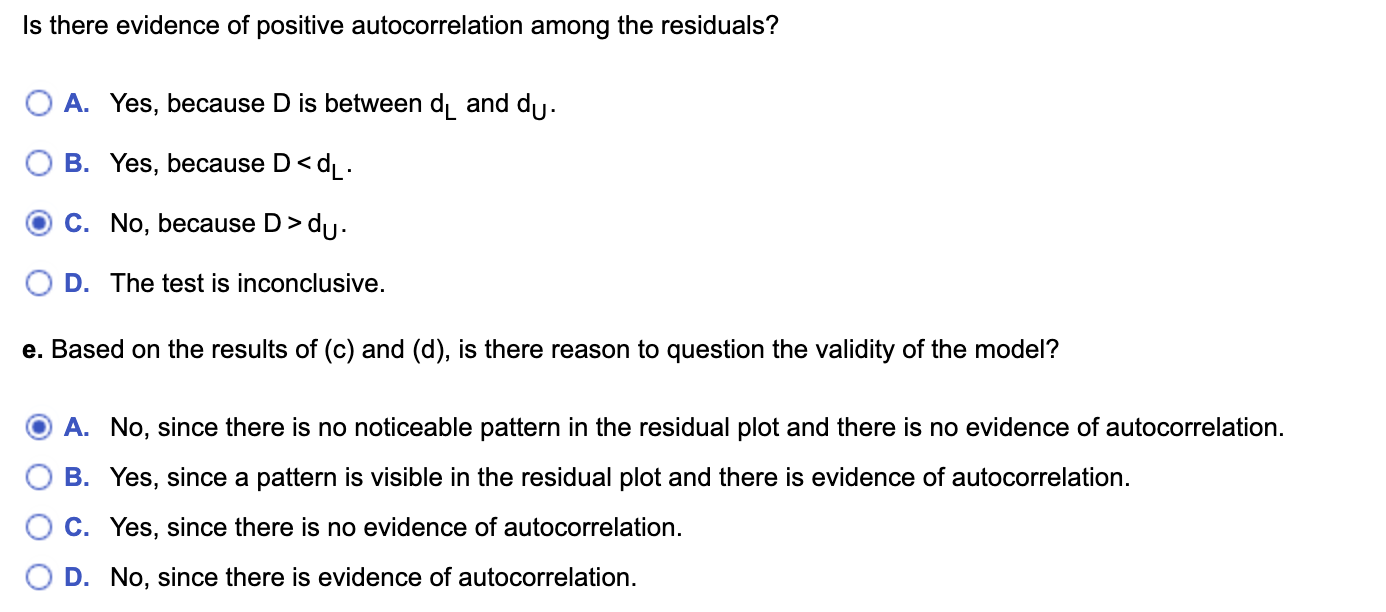
\fAn employee at a coffee shop hypothesizes that the harder the espresso grounds are tamped down into the portat'llter before brewing, the longer the separation time of the heart, body, and crema will be. The accompanying data table shows the results of this experiment. The independent variable tamp measures the distance, in inches, between the espresso grounds and the top of the portalter. The dependent variable time is the number of seconds the heart, body, and crema are separated. Complete parts (a) through (f) below. Click the icon to view the data table. 5 Click the icon to view a table of critical values of the Durbin-Watson statistic. a. Use the least-squares method to develop a single regression equation with Time as the dependent variable and Tamp as the independent variable. ?. = 14.566 + 0.816 X (Round to three decimal places as needed.) b. Predict the mean separation time for a tamp distance of 0.45 inch. 9} = 14.9332 seconds (Round to four decimal places as needed.) c. Plot the residuals versus the time order of experimentation. Choose the correct graph below. A. OB. QC. on. Residuals Residuals Residuals Residuals Time Order Time Order Time Order Time Order Are there any noticeable patterns? O A. Yes, the residuals consistently alternate between positive and negative. O B. Yes, the residuals form a clear linear pattern. O C. Yes, the residuals form a clear nonlinear pattern. O D. No, the residuals do not form a clear pattern. d. Compute the Durbin-Watson statistic. At the 0.05 level of significance, is there evidence of positive autocorrelation among the residuals? D = 2 (Round to two decimal places as needed.) Use the given table to find the critical values of the Durbin-Watson statistic. dL = (Round to two decimal places as needed.) du = (Round to two decimal places as needed.)Is there evidence of positive autocorrelation among the residuals? O A. Yes, because D is between dL and dU. O B. Yes, because D
Step by Step Solution
There are 3 Steps involved in it

Get step-by-step solutions from verified subject matter experts