

Question: I have been given three text files trades.txt, income.txt, and live-prices.txt. I have to create a stock portfolio using python from the files given. **trades.txt**
I have been given three text files trades.txt, income.txt, and live-prices.txt.
I have to create a stock portfolio using python from the files given.
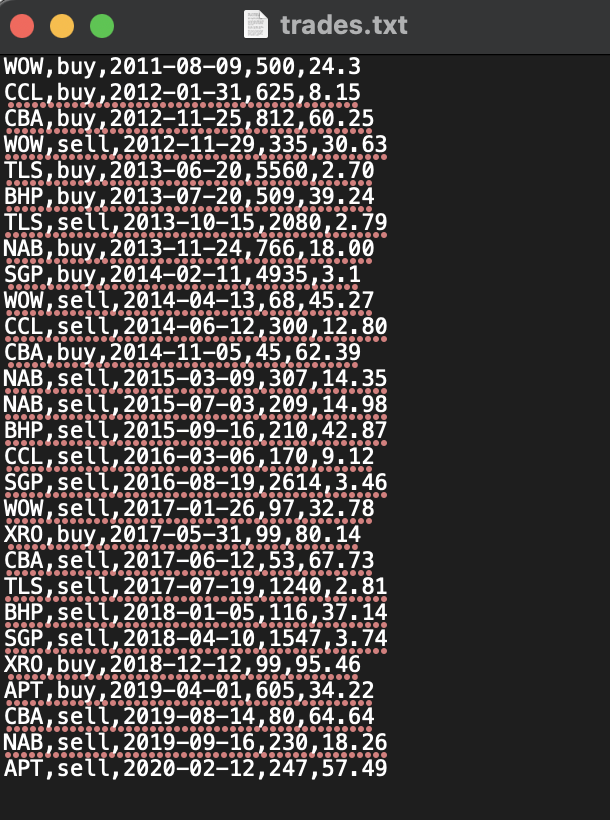
**trades.txt** file contains a list of stock trades (purchase or sale) over a period of roughly ten years. Each line contains data for a single trade. The fields in each line, in order, are stock code (3 letters), trade type (buy or sell), date, units traded, share price per unit. All trades have been sorted chronologically.
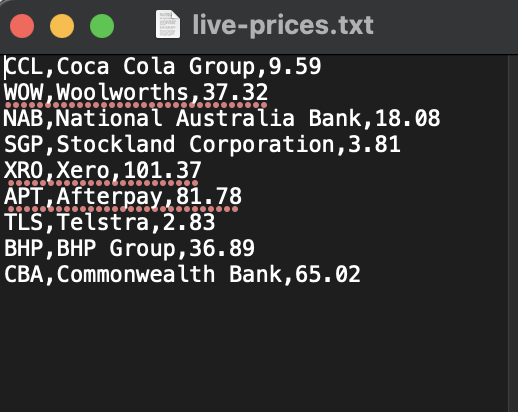
**live-prices.txt** is supposed to contain current live price of all nine stocks involved in trades. Each record contains the stock code, company full name and live price.
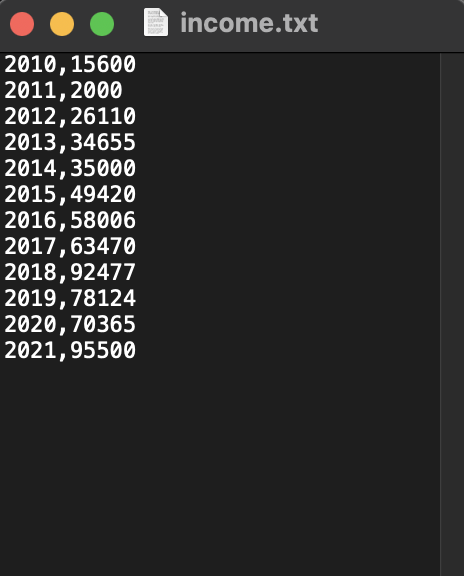
**income.txt** stores the historical record of annual gross income for a given FSP client. For example, the first line contains 2010,156000 which means the client earned $15,600 in the financial year that started on 1st July 2009 and ended on 30th June 2010.
To work with dates, you should use the datetime module from Python standard library. It contains a function fromisoformat which takes in a string in YYYY-MM-DD format and returns a date object. These date objects can be easily compared with each other to see which one lies earlier. If the date is invalid, this function call will raise a ValueError. Following code demonstrates how this module can be used.
from datetime import date fy_start = date.fromisoformat('2017-07-01') trade_date = date.fromisoformat('2017-07-19') print(trade_date > fy_start) # outputs True |
Your program should be able to handle following types of errors situations
- Invalid format of data in data files (e.g. more of less fields per record, 4 letter stock code, invalid dates, negative price or number of units etc.)
- Incorrect filenames provided by user
- Invalid year value provided by user
In case of any of the above errors, display an error message and exit the program.
Constraint: You can only import these Python modules: sys, datetime, math and matplotlib
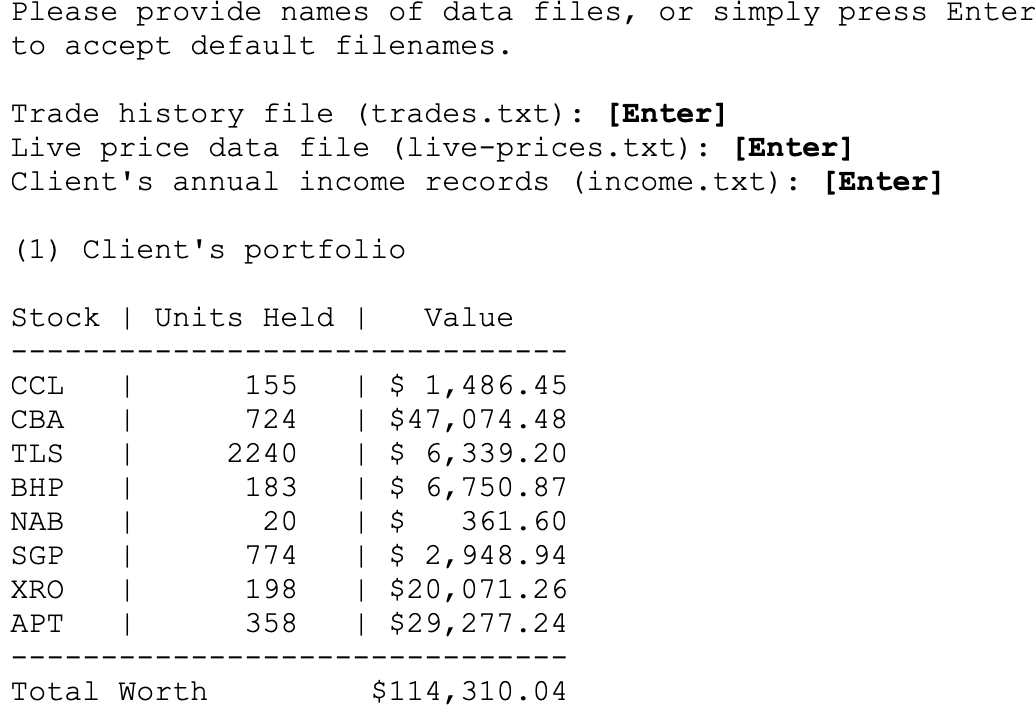
1. How can I create a tabular portfolio of client, that is, the list of stocks *currently* held. Some stocks were purchased and completely sold in the past, hence they will not be part of portfolio. See the sample run below for an example of tabular output.
2. Display the portfolio in the form of a pie chart. Each slice in the chart would represent a single holding of the portfolio. Slices should be labelled with stock code. Plotting should be done via matplotlib library.
Display of piechart should be as follows:
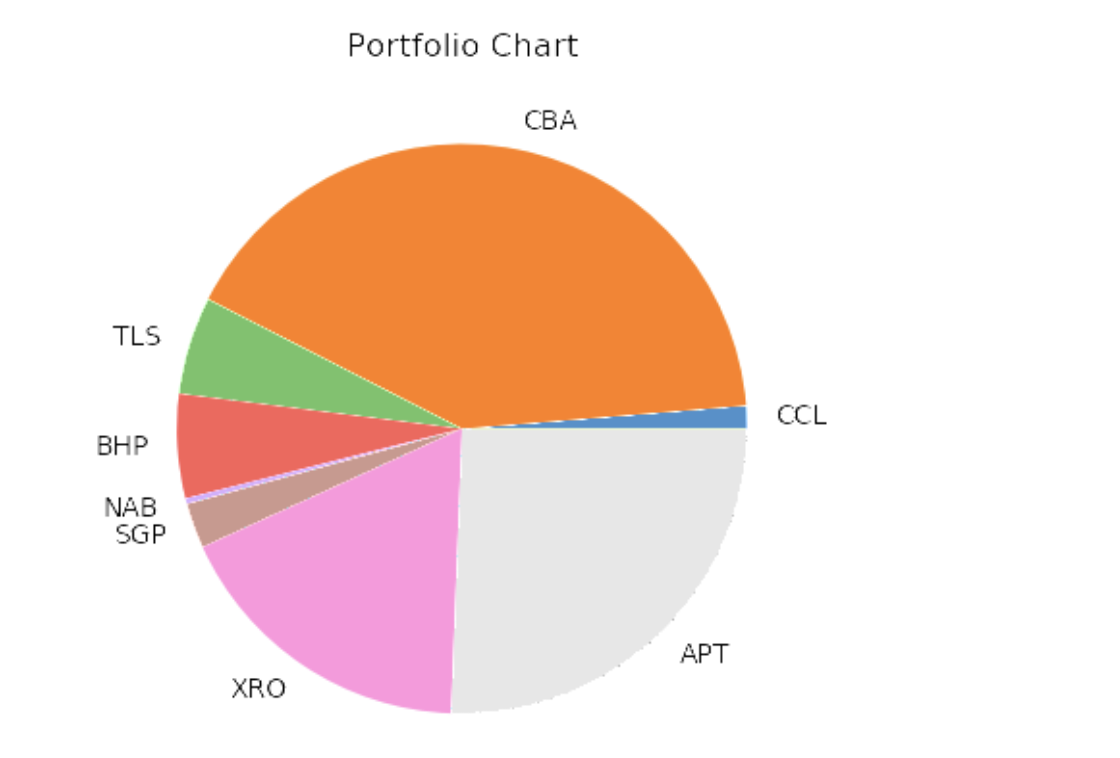
trades.txt DOOOOOOO 0000000000 bo 000 dl ..000 WOW, buy, 2011-08-09,500,24.3 CCL buy, 2012-01-31,625, 8.15 CBA, buy, 2012-11-25,812,60.25 WOW, sell, 2012-11-29,335,30.63 TLS, buy, 2013-06-20,5560,2.70 BHP, buy, 2013-07-20,509, 39.24 TLS, sell, 2013-10-15, 2080, 2.79 NAB, buy, 2013-11-24,766, 18.00 SGP, buy, 2014-02-11,4935,3.1 obr... WOW, sell, 2014-04-13,68,45.27 CCL, sell, 2014-06-12,300,12.80 CBA, buy, 2014-11-05,45,62.39 NAB, sell, 2015-03-09,307, 14.35 ......... NAB, sell, 2015-07-03,209, 14.98 BHP, sell, 2015-09-16, 210,42.87 CCL, sell, 2016-03-06, 170,9.12 SGP, sell, 2016-08-19,2614,3.46 WOW, sell, 2017-01-26,97, 32.78 XRO, buy, 2017-05-31, 99,80.14 CBA, sell, 2017-06-12,53,67.73 TLS, sell, 2017-07-19, 1240,2.81 BHP, sell, 2018-01-05, 116,37.14 SGP, sell, 2018-04-10, 1547,3.74 XRO, buy, 2018-12-12,99,95.46 APT, buy, 2019-04-01,605, 34.22 CBA, sell, 2019-08-14,80,64.64 NAB, sell, 2019-09-16,230,18.26 alla APT, sell, 2020-02-12,247,57.49 900 Jo.000000 eos 20...! live-prices.txt CCL, Coca Cola Group, 9.59 WOW, Woolworths, 37.32 NAB, National Australia Bank, 18.08 SGP, Stockland Corporation,3.81 XRO,Xero, 101.37 APT,Afterpay, 81.78 TLS, Telstra, 2.83 BHP, BHP Group, 36.89 CBA, Commonwealth Bank, 65.02 income.txt 2010, 15600 2011, 2000 2012, 26110 2013,34655 2014, 35000 2015,49420 2016, 58006 2017,63470 2018, 92477 2019,78124 2020,70365 2021,95500 Please provide names of data files, or simply press Enter to accept default filenames. Trade history file (trades.txt): [Enter] Live price data file (live-prices.txt): [Enter] Client's annual income records (income.txt): [Enter] (1) Client's portfolio Stock | Units Held | Value CCL CBA TLS BHP NAB SGP XRO APT 155 724 2240 183 20 774 198 358 | $ 1,486.45 | $ 47,074.48 | $ 6,339.20 | $ 6,750.87 $ 361.60 $ 2,948.94 | $20,071.26 | $29,277.24 I Total Worth $114,310.04 Portfolio Chart CBA TLS CCL BHP NAB SGP APT XRO trades.txt DOOOOOOO 0000000000 bo 000 dl ..000 WOW, buy, 2011-08-09,500,24.3 CCL buy, 2012-01-31,625, 8.15 CBA, buy, 2012-11-25,812,60.25 WOW, sell, 2012-11-29,335,30.63 TLS, buy, 2013-06-20,5560,2.70 BHP, buy, 2013-07-20,509, 39.24 TLS, sell, 2013-10-15, 2080, 2.79 NAB, buy, 2013-11-24,766, 18.00 SGP, buy, 2014-02-11,4935,3.1 obr... WOW, sell, 2014-04-13,68,45.27 CCL, sell, 2014-06-12,300,12.80 CBA, buy, 2014-11-05,45,62.39 NAB, sell, 2015-03-09,307, 14.35 ......... NAB, sell, 2015-07-03,209, 14.98 BHP, sell, 2015-09-16, 210,42.87 CCL, sell, 2016-03-06, 170,9.12 SGP, sell, 2016-08-19,2614,3.46 WOW, sell, 2017-01-26,97, 32.78 XRO, buy, 2017-05-31, 99,80.14 CBA, sell, 2017-06-12,53,67.73 TLS, sell, 2017-07-19, 1240,2.81 BHP, sell, 2018-01-05, 116,37.14 SGP, sell, 2018-04-10, 1547,3.74 XRO, buy, 2018-12-12,99,95.46 APT, buy, 2019-04-01,605, 34.22 CBA, sell, 2019-08-14,80,64.64 NAB, sell, 2019-09-16,230,18.26 alla APT, sell, 2020-02-12,247,57.49 900 Jo.000000 eos 20...! live-prices.txt CCL, Coca Cola Group, 9.59 WOW, Woolworths, 37.32 NAB, National Australia Bank, 18.08 SGP, Stockland Corporation,3.81 XRO,Xero, 101.37 APT,Afterpay, 81.78 TLS, Telstra, 2.83 BHP, BHP Group, 36.89 CBA, Commonwealth Bank, 65.02 income.txt 2010, 15600 2011, 2000 2012, 26110 2013,34655 2014, 35000 2015,49420 2016, 58006 2017,63470 2018, 92477 2019,78124 2020,70365 2021,95500 Please provide names of data files, or simply press Enter to accept default filenames. Trade history file (trades.txt): [Enter] Live price data file (live-prices.txt): [Enter] Client's annual income records (income.txt): [Enter] (1) Client's portfolio Stock | Units Held | Value CCL CBA TLS BHP NAB SGP XRO APT 155 724 2240 183 20 774 198 358 | $ 1,486.45 | $ 47,074.48 | $ 6,339.20 | $ 6,750.87 $ 361.60 $ 2,948.94 | $20,071.26 | $29,277.24 I Total Worth $114,310.04 Portfolio Chart CBA TLS CCL BHP NAB SGP APT XRO
Step by Step Solution
There are 3 Steps involved in it

Get step-by-step solutions from verified subject matter experts