

Question: I have been stuck on this question (specifically part A) as each time I try to compute on statcrunch I am given an error message
I have been stuck on this question (specifically part A) as each time I try to compute on statcrunch I am given an error message stating that "no rows in resulting data set". I have been using the Two Sample T hypothesis test and have had no luck. Am I approaching the question incorrectly?
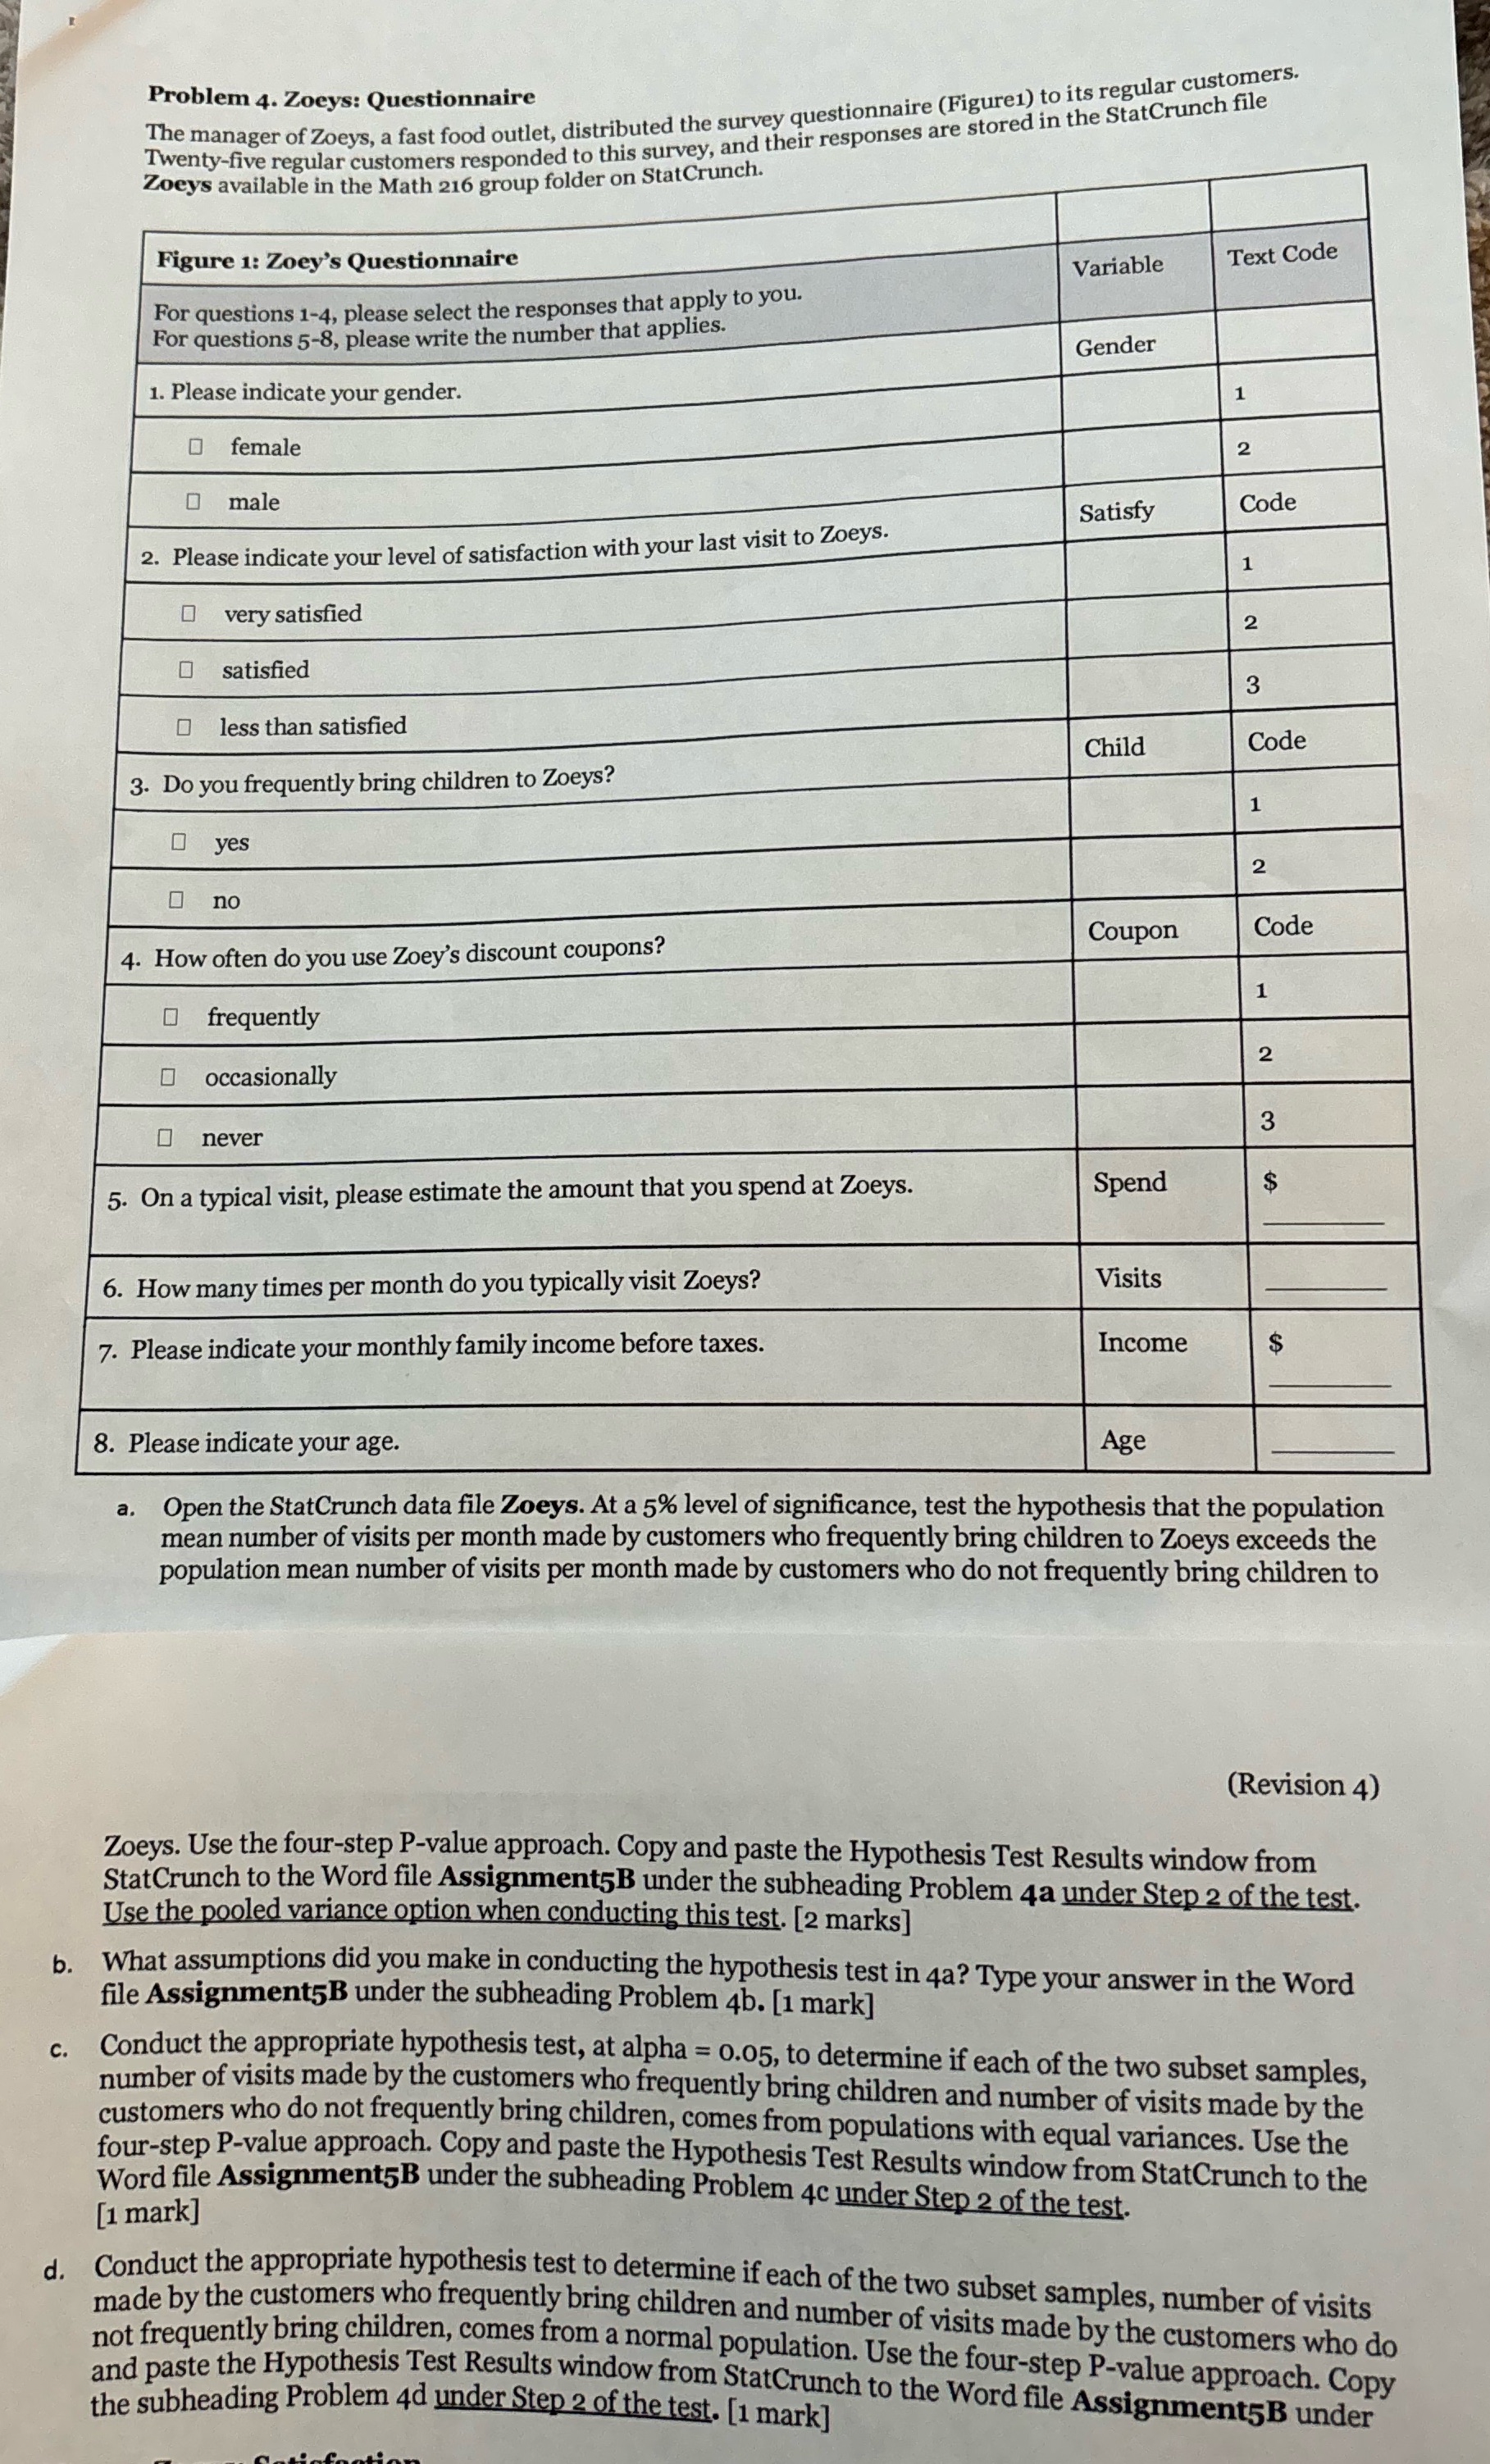
Problem 4. Zoeys: Questionnaire The manager of Zoeys, a fast food outlet, distributed the survey questionnaire (Figure1) to its regular customers. Twenty-five regular customers responded to this survey, and their responses are stored in the StatCrunch file Zoeys available in the Math 216 group folder on StatCrunch. Figure 1: Zoey's Questionnaire Variable Text Code For questions 1-4, please select the responses that apply to you. For questions 5-8, please write the number that applies. Gender 1. Please indicate your gender. 0 female 0 male Satisfy Code 2. Please indicate your level of satisfaction with your last visit to Zoeys. very satisfied 2 0 satisfied 3 less than satisfied Child Code 3. Do you frequently bring children to Zoeys? yes 2 no Coupon Code 4. How often do you use Zoey's discount coupons? 0 frequently 2 occasionally never 3 5. On a typical visit, please estimate the amount that you spend at Zoeys. Spend 6. How many times per month do you typically visit Zoeys? Visits 7. Please indicate your monthly family income before taxes. Income 8. Please indicate your age. Age a. Open the StatCrunch data file Zoeys. At a 5% level of significance, test the hypothesis that the population mean number of visits per month made by customers who frequently bring children to Zoeys exceeds the population mean number of visits per month made by customers who do not frequently bring children to (Revision 4) Zoeys. Use the four-step P-value approach. Copy and paste the Hypothesis Test Results window from StatCrunch to the Word file Assignment5B under the subheading Problem 4a under Step 2 of the test. Use the pooled variance option when conducting this test. [2 marks] b . What assumptions did you make in conducting the hypothesis test in 4a? Type your answer in the Word file Assignment5B under the subheading Problem 4b. [1 mark] C . Conduct the appropriate hypothesis test, at alpha = 0.05, to determine if each of the two subset samples, number of visits made by the customers who frequently bring children and number of visits made by the customers who do not frequently bring children, comes from populations with equal variances. Use the four-step P-value approach. Copy and paste the Hypothesis Test Results window from StatCrunch to the [1 mark] Word file Assignment5B under the subheading Problem 4c under Step 2 of the test. d. Conduct the appropriate hypothesis test to determine if each of the two subset samples, number of visits made by the customers who frequently bring children and number of visits made by the customers who do not frequently bring children, comes from a normal population. Use the four-step P-value approach. Copy and paste the Hypothesis Test Results window from StatCrunch to the Word file Assignment5B under the subheading Problem 4d under Step 2 of the test. [1 mark]
Step by Step Solution
There are 3 Steps involved in it

Get step-by-step solutions from verified subject matter experts