

Question: I have collected the following data from 75 students in three undergraduate classes. The data includes the amount of time to complete the exam (duration)
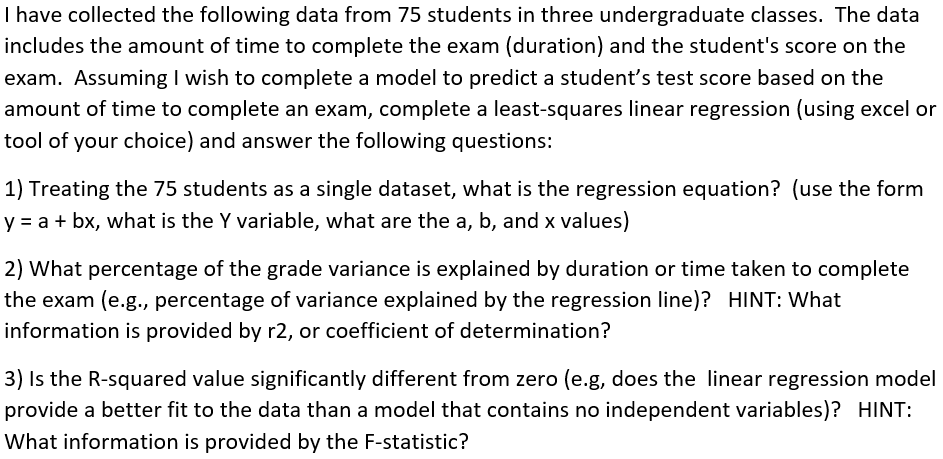
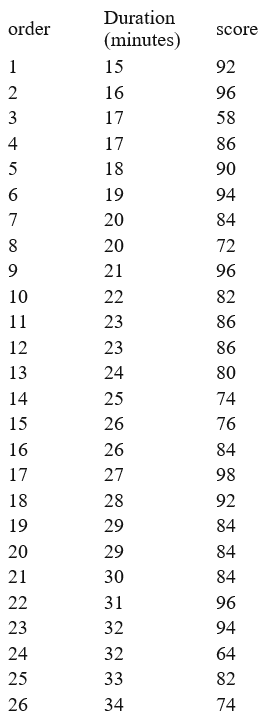
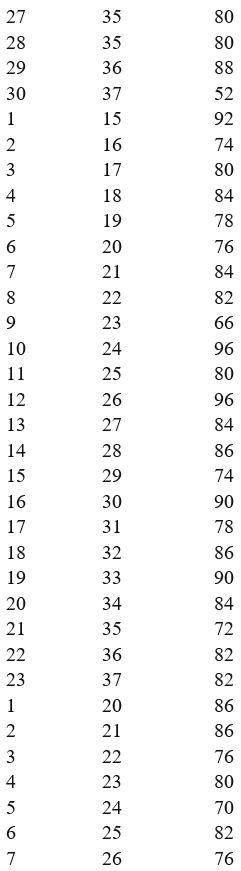
I have collected the following data from 75 students in three undergraduate classes. The data includes the amount of time to complete the exam (duration) and the student's score on the exam. Assuming I wish to complete a model to predict a student's test score based on the amount of time to complete an exam, complete a least-squares linear regression (using excel or tool of your choice) and answer the following questions: 1) Treating the 75 students as a single dataset, what is the regression equation? (use the form y=a+bx, what is the Y variable, what are the a,b, and x values) 2) What percentage of the grade variance is explained by duration or time taken to complete the exam (e.g., percentage of variance explained by the regression line)? HINT: What information is provided by r2, or coefficient of determination? 3) Is the R-squared value significantly different from zero (e.g, does the linear regression model provide a better fit to the data than a model that contains no independent variables)? HINT: What information is provided by the F-statistic? \begin{tabular}{lll} order & \begin{tabular}{l} Duration \\ (minutes) \end{tabular} & score \\ 1 & 15 & 92 \\ 2 & 16 & 96 \\ 3 & 17 & 58 \\ 4 & 17 & 86 \\ 5 & 18 & 90 \\ 6 & 19 & 94 \\ 7 & 20 & 84 \\ 8 & 20 & 72 \\ 9 & 21 & 96 \\ 10 & 22 & 82 \\ 11 & 23 & 86 \\ 12 & 23 & 86 \\ 13 & 24 & 80 \\ 14 & 25 & 74 \\ 15 & 26 & 76 \\ 16 & 26 & 84 \\ 17 & 27 & 98 \\ 18 & 28 & 92 \\ 19 & 29 & 84 \\ 20 & 29 & 84 \\ 21 & 30 & 84 \\ 22 & 31 & 96 \\ 23 & 32 & 94 \\ 24 & 32 & 64 \\ 25 & 33 & 82 \\ 26 & 34 & 74 \end{tabular} \begin{tabular}{lll} 27 & 35 & 80 \\ 28 & 35 & 80 \\ 29 & 36 & 88 \\ 30 & 37 & 52 \\ 1 & 15 & 92 \\ 2 & 16 & 74 \\ 3 & 17 & 80 \\ 4 & 18 & 84 \\ 5 & 19 & 78 \\ 6 & 20 & 76 \\ 7 & 21 & 84 \\ 8 & 22 & 82 \\ 9 & 23 & 66 \\ 10 & 24 & 96 \\ 11 & 25 & 80 \\ 12 & 26 & 96 \\ 13 & 27 & 84 \\ 14 & 28 & 86 \\ 15 & 29 & 74 \\ 16 & 30 & 90 \\ 17 & 31 & 78 \\ 18 & 32 & 86 \\ 19 & 33 & 90 \\ 20 & 34 & 84 \\ 21 & 35 & 72 \\ 22 & 36 & 82 \\ 23 & 37 & 82 \\ 1 & 20 & 86 \\ 2 & 21 & 86 \\ 3 & 22 & 76 \\ 4 & 23 & 80 \\ 5 & 24 & 70 \\ 6 & 25 & 82 \\ 7 & 26 & 76 \end{tabular} \begin{tabular}{lll} 8 & 27 & 70 \\ 9 & 28 & 88 \\ 10 & 29 & 76 \\ 11 & 30 & 94 \\ 12 & 31 & 80 \\ 13 & 32 & 90 \\ 14 & 33 & 90 \\ 15 & 34 & 74 \\ 16 & 35 & 90 \\ 17 & 36 & 68 \\ 18 & 37 & 78 \\ 19 & 38 & 76 \\ 20 & 39 & 88 \\ 21 & 40 & 68 \\ 22 & 41 & 86 \end{tabular}
Step by Step Solution
There are 3 Steps involved in it

Get step-by-step solutions from verified subject matter experts