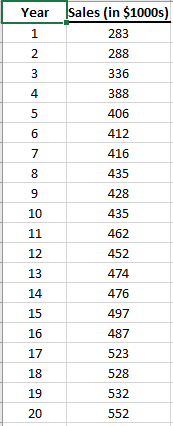
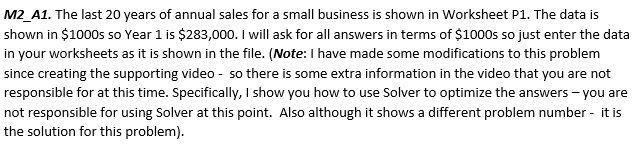
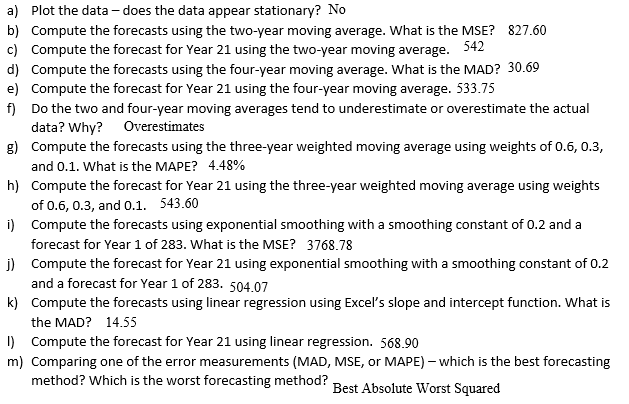
Question: I have done everything but it seems that the answer for k. (14.55) is wrong and I need help with this one. Year Sales (in

I have done everything but it seems that the answer for k. (14.55) is wrong and I need help with this one.

I have done everything but it seems that the

I have done everything but it seems that the

I have done everything but it seems that the

Year Sales (in $1000s) 1 283 2 288 3 336 4 388 5 406 6 7 412 416 435 8 9 10 428 435 462 452 11 12 13 474 14 476 497 15 16 487 17 523 18 528 532 19 20 552 M2_A1. The last 20 years of annual sales for a small business is shown in Worksheet P1. The data is shown in $1000s so Year 1 is $283,000. I will ask for all answers in terms of $1000s so just enter the data in your worksheets as it is shown in the file. (Note: I have made some modifications to this problem since creating the supporting video - so there is some extra information in the video that you are not responsible for at this time. Specifically, I show you how to use Solver to optimize the answers - you are not responsible for using Solver at this point. Also although it shows a different problem number - it is the solution for this problem). a) Plot the data - does the data appear stationary? No b) Compute the forecasts using the two-year moving average. What is the MSE? 827.60 c) Compute the forecast for Year 21 using the two-year moving average. 542 d) Compute the forecasts using the four-year moving average. What is the MAD? 30.69 e) Compute the forecast for Year 21 using the four-year moving average. 533.75 f) Do the two and four-year moving averages tend to underestimate or overestimate the actual data? Why? Overestimates g) Compute the forecasts using the three-year weighted moving average using weights of 0.6, 0.3, and 0.1. What is the MAPE? 4.48% h) Compute the forecast for Year 21 using the three-year weighted moving average using weights of 0.6, 0.3, and 0.1. 543.60 i) Compute the forecasts using exponential smoothing with a smoothing constant of 0.2 and a forecast for Year 1 of 283. What is the MSE? 3768.78 j) Compute the forecast for Year 21 using exponential smoothing with a smoothing constant of 0.2 and a forecast for Year 1 of 283. 504.07 k) Compute the forecasts using linear regression using Excel's slope and intercept function. What is the MAD? 14.55 1) Compute the forecast for Year 21 using linear regression. 568.90 m) Comparing one of the error measurements (MAD, MSE, or MAPE) which is the best forecasting method? Which is the worst forecasting method? Best Absolute Worst Squared

Step by Step Solution

There are 3 Steps involved in it

1 Expert Approved Answer
Step: 1 Unlock blur-text-image
Question Has Been Solved by an Expert!

Get step-by-step solutions from verified subject matter experts

Step: 2 Unlock
Step: 3 Unlock

Students Have Also Explored These Related General Management Questions!