

Question: I have provided the data necesarry for this question. All I need is Part A with shown work, I would appreciate it very much, thank
I have provided the data necesarry for this question. All I need is Part A with shown work, I would appreciate it very much, thank you!
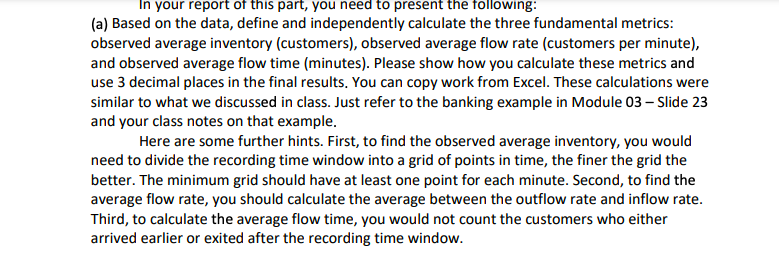
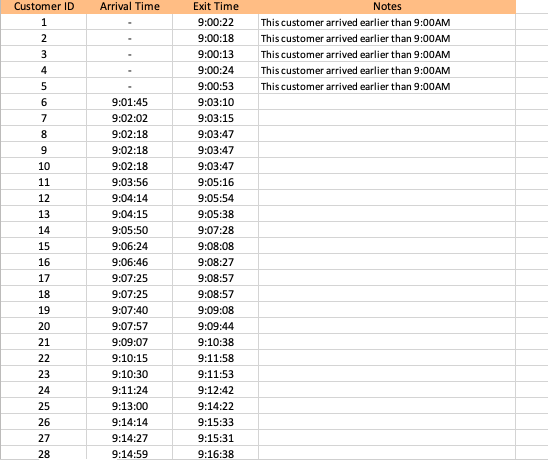
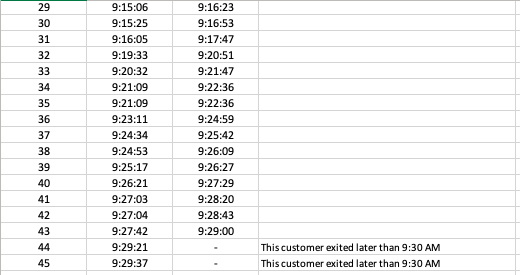
(a) Based on the data, define and independently calculate the three fundamental metrics: observed average inventory (customers), observed average flow rate (customers per minute), and observed average flow time (minutes). Please show how you calculate these metrics and use 3 decimal places in the final results. You can copy work from Excel. These calculations were similar to what we discussed in class. Just refer to the banking example in Module 03 - Slide 23 and your class notes on that example. Here are some further hints. First, to find the observed average inventory, you would need to divide the recording time window into a grid of points in time, the finer the grid the better. The minimum grid should have at least one point for each minute. Second, to find the average flow rate, you should calculate the average between the outflow rate and inflow rate. Third, to calculate the average flow time, you would not count the customers who either arrived earlier or exited after the recording time window. \begin{tabular}{|c|c|c|c|} \hline Customer ID & Arrival Time & Exit Time & Notes \\ \hline 1 & & 9:00:22 & This customer arrived earlier than 9:00AM \\ \hline 2 & & 9:00:18 & This customer arrived earlier than 9:00AM \\ \hline 3 & & 9:00:13 & This customer arrived earlier than 9:00AM \\ \hline 4 & & 9:00:24 & This customer arrived earlier than 9:00AM \\ \hline 5 & & 9:00:53 & This customer arrived earlier than 9:00AM \\ \hline 6 & 9:01:45 & 9:03:10 & \\ \hline 7 & 9:02:02 & 9:03:15 & \\ \hline 8 & 9:02:18 & 9:03:47 & \\ \hline 9 & 9:02:18 & 9:03:47 & \\ \hline 10 & 9:02:18 & 9:03:47 & \\ \hline 11 & 9:03:56 & 9:05:16 & \\ \hline 12 & 9:04:14 & 9:05:54 & \\ \hline 13 & 9:04:15 & 9:05:38 & \\ \hline 14 & 9:05:50 & 9:07:28 & \\ \hline 15 & 9:06:24 & 9:08:08 & \\ \hline 16 & 9:06:46 & 9:08:27 & \\ \hline 17 & 9:07:25 & 9:08:57 & \\ \hline 18 & 9:07:25 & 9:08:57 & \\ \hline 19 & 9:07:40 & 9:09:08 & \\ \hline 20 & 9:07:57 & 9:09:44 & \\ \hline 21 & 9:09:07 & 9:10:38 & \\ \hline 22 & 9:10:15 & 9:11:58 & \\ \hline 23 & 9:10:30 & 9:11:53 & \\ \hline 24 & 9:11:24 & 9:12:42 & \\ \hline 25 & 9:13:00 & 9:14:22 & \\ \hline 26 & 9:14:14 & 9:15:33 & \\ \hline 27 & 9:14:27 & 9:15:31 & \\ \hline 28 & 9:14:59 & 9:16:38 & \\ \hline \end{tabular} \begin{tabular}{|c|c|c|c|} \hline 29 & 9:15:06 & 9:16:23 \\ \hline 30 & 9:15:25 & 9:16:53 & \\ \hline 31 & 9:16:05 & 9:17:47 & \\ \hline 32 & 9:19:33 & 9:20:51 & \\ \hline 33 & 9:20:32 & 9:21:47 & \\ \hline 34 & 9:21:09 & 9:22:36 & \\ \hline 35 & 9:21:09 & 9:22:36 & \\ \hline 36 & 9:23:11 & 9:24:59 & \\ \hline 37 & 9:24:34 & 9:25:42 & \\ \hline 38 & 9:24:53 & 9:26:09 & \\ \hline 39 & 9:25:17 & 9:26:27 & \\ \hline 40 & 9:26:21 & 9:27:29 & \\ \hline 41 & 9:27:03 & 9:28:20 & \\ \hline 42 & 9:27:04 & 9:28:43 & \\ \hline 43 & 9:27:42 & 9:29:00 & \\ \hline 44 & 9:29:21 & & This customer exited later than 9:30 AM \\ \hline 45 & 9:29:37 & & This customer exited later than 9:30 AM \\ \hline \end{tabular} (a) Based on the data, define and independently calculate the three fundamental metrics: observed average inventory (customers), observed average flow rate (customers per minute), and observed average flow time (minutes). Please show how you calculate these metrics and use 3 decimal places in the final results. You can copy work from Excel. These calculations were similar to what we discussed in class. Just refer to the banking example in Module 03 - Slide 23 and your class notes on that example. Here are some further hints. First, to find the observed average inventory, you would need to divide the recording time window into a grid of points in time, the finer the grid the better. The minimum grid should have at least one point for each minute. Second, to find the average flow rate, you should calculate the average between the outflow rate and inflow rate. Third, to calculate the average flow time, you would not count the customers who either arrived earlier or exited after the recording time window. \begin{tabular}{|c|c|c|c|} \hline Customer ID & Arrival Time & Exit Time & Notes \\ \hline 1 & & 9:00:22 & This customer arrived earlier than 9:00AM \\ \hline 2 & & 9:00:18 & This customer arrived earlier than 9:00AM \\ \hline 3 & & 9:00:13 & This customer arrived earlier than 9:00AM \\ \hline 4 & & 9:00:24 & This customer arrived earlier than 9:00AM \\ \hline 5 & & 9:00:53 & This customer arrived earlier than 9:00AM \\ \hline 6 & 9:01:45 & 9:03:10 & \\ \hline 7 & 9:02:02 & 9:03:15 & \\ \hline 8 & 9:02:18 & 9:03:47 & \\ \hline 9 & 9:02:18 & 9:03:47 & \\ \hline 10 & 9:02:18 & 9:03:47 & \\ \hline 11 & 9:03:56 & 9:05:16 & \\ \hline 12 & 9:04:14 & 9:05:54 & \\ \hline 13 & 9:04:15 & 9:05:38 & \\ \hline 14 & 9:05:50 & 9:07:28 & \\ \hline 15 & 9:06:24 & 9:08:08 & \\ \hline 16 & 9:06:46 & 9:08:27 & \\ \hline 17 & 9:07:25 & 9:08:57 & \\ \hline 18 & 9:07:25 & 9:08:57 & \\ \hline 19 & 9:07:40 & 9:09:08 & \\ \hline 20 & 9:07:57 & 9:09:44 & \\ \hline 21 & 9:09:07 & 9:10:38 & \\ \hline 22 & 9:10:15 & 9:11:58 & \\ \hline 23 & 9:10:30 & 9:11:53 & \\ \hline 24 & 9:11:24 & 9:12:42 & \\ \hline 25 & 9:13:00 & 9:14:22 & \\ \hline 26 & 9:14:14 & 9:15:33 & \\ \hline 27 & 9:14:27 & 9:15:31 & \\ \hline 28 & 9:14:59 & 9:16:38 & \\ \hline \end{tabular} \begin{tabular}{|c|c|c|c|} \hline 29 & 9:15:06 & 9:16:23 \\ \hline 30 & 9:15:25 & 9:16:53 & \\ \hline 31 & 9:16:05 & 9:17:47 & \\ \hline 32 & 9:19:33 & 9:20:51 & \\ \hline 33 & 9:20:32 & 9:21:47 & \\ \hline 34 & 9:21:09 & 9:22:36 & \\ \hline 35 & 9:21:09 & 9:22:36 & \\ \hline 36 & 9:23:11 & 9:24:59 & \\ \hline 37 & 9:24:34 & 9:25:42 & \\ \hline 38 & 9:24:53 & 9:26:09 & \\ \hline 39 & 9:25:17 & 9:26:27 & \\ \hline 40 & 9:26:21 & 9:27:29 & \\ \hline 41 & 9:27:03 & 9:28:20 & \\ \hline 42 & 9:27:04 & 9:28:43 & \\ \hline 43 & 9:27:42 & 9:29:00 & \\ \hline 44 & 9:29:21 & & This customer exited later than 9:30 AM \\ \hline 45 & 9:29:37 & & This customer exited later than 9:30 AM \\ \hline \end{tabular}
Step by Step Solution
There are 3 Steps involved in it
1 Expert Approved Answer
Step: 1 Unlock

Question Has Been Solved by an Expert!
Get step-by-step solutions from verified subject matter experts
Step: 2 Unlock
Step: 3 Unlock