

Question: I have struggle doing this question, can you please help me? By hands or by excel will be fine (maybe not minitab). (1) A researcher
I have struggle doing this question, can you please help me? By hands or by excel will be fine (maybe not minitab).
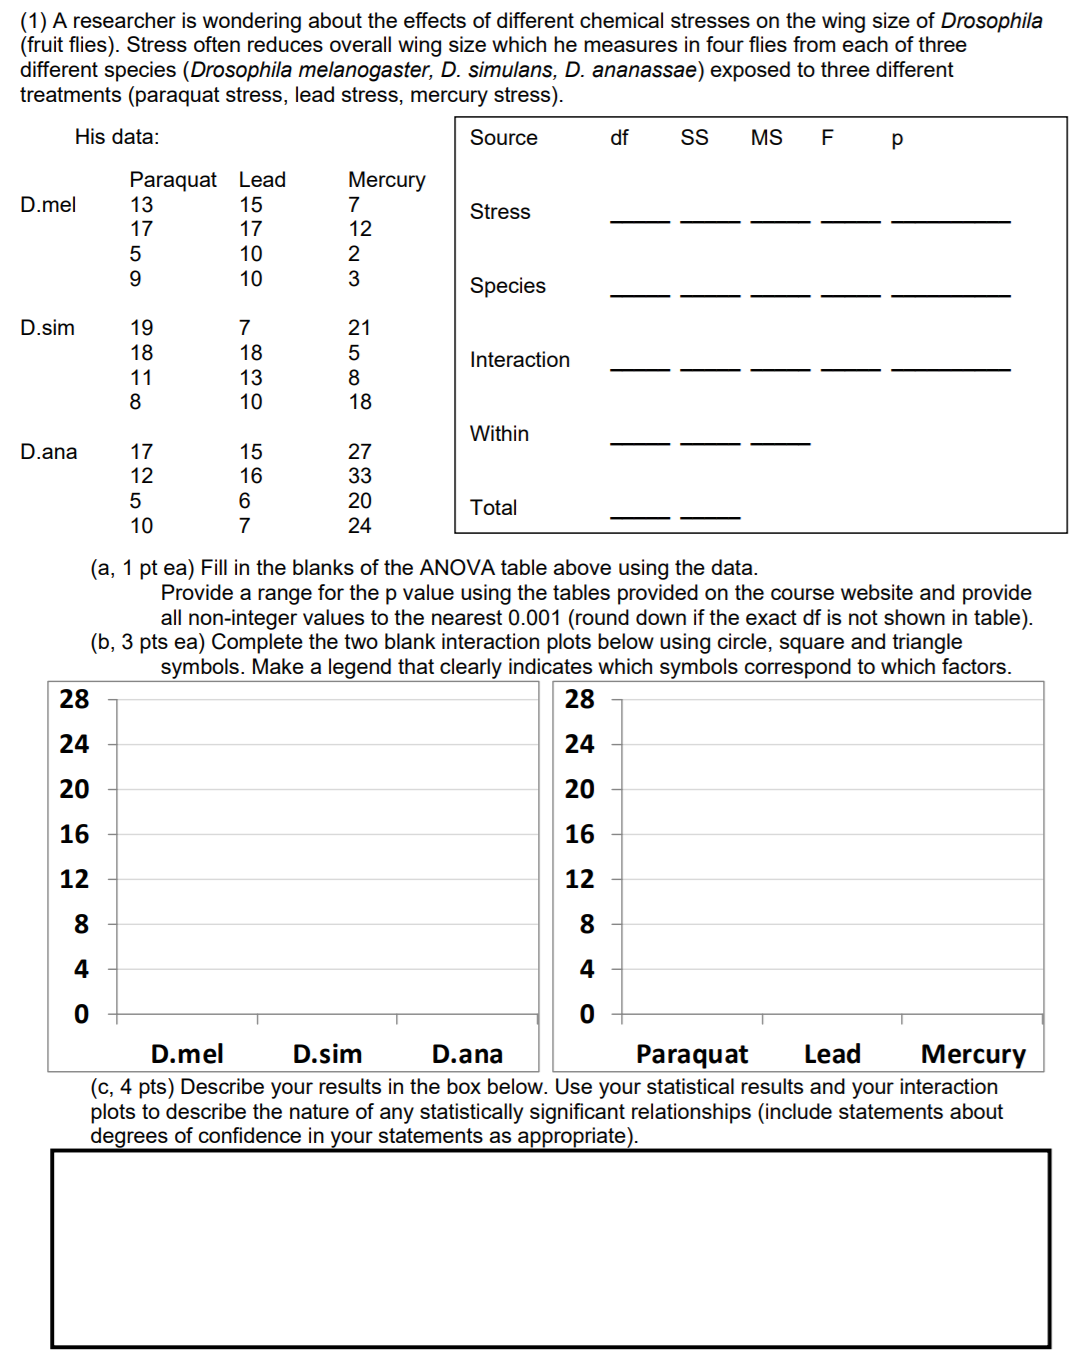
(1) A researcher is wondering about the effects of different chemical stresses on the wing size of Drosophila (fruit flies). Stress often reduces overall wing size which he measures in four flies from each of three different species (Drosophila melanogaster, D. simulans, D. ananassae) exposed to three different treatments (paraquat stress, lead stress, mercury stress). His data: Source df SS MS F P Paraquat Lead Mercury D.mel 13 15 7 17 17 12 Stress 5 10 9 10 N 3 Species D.sim 19 7 21 18 18 5 11 13 8 Interaction 8 10 18 D.ana 17 15 27 Within 12 16 33 10 6 20 24 Total (a, 1 pt ea) Fill in the blanks of the ANOVA table above using the data. Provide a range for the p value using the tables provided on the course website and provide all non-integer values to the nearest 0.001 (round down if the exact of is not shown in table). (b, 3 pts ea) Complete the two blank interaction plots below using circle, square and triangle symbols. Make a legend that clearly indicates which symbols correspond to which factors. 28 28 24 24 20 20 16 16 12 12 8 8 O 0 D.mel D.sim D.ana Paraquat Lead Mercury (c, 4 pts) Describe your results in the box below. Use your statistical results and your interaction plots to describe the nature of any statistically significant relationships (include statements about degrees of confidence in your statements as appropriate)
Step by Step Solution
There are 3 Steps involved in it

Get step-by-step solutions from verified subject matter experts