

I have the following questions/issues relating to the NetZero attitude dataset. 1. Is there a willingness among
Question:
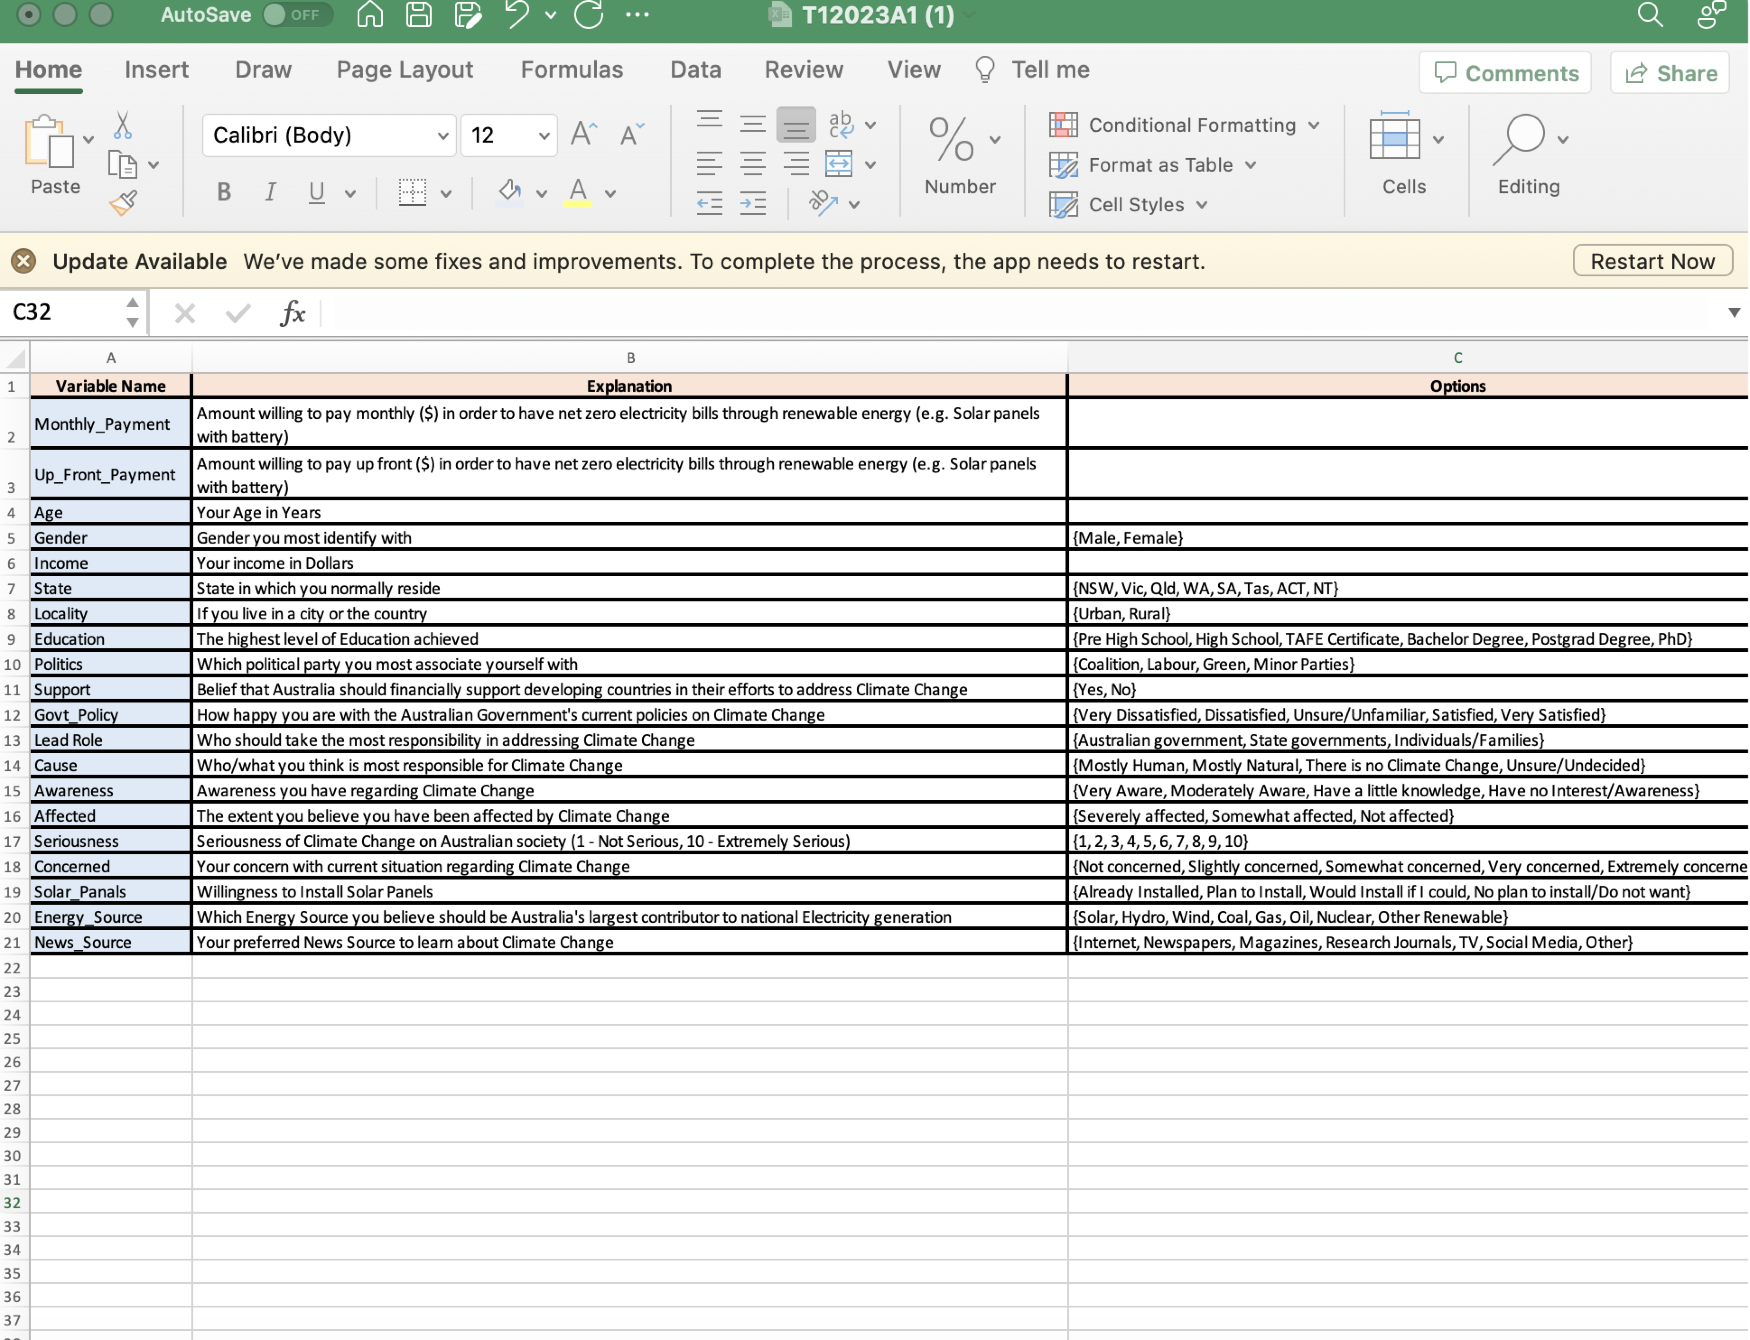
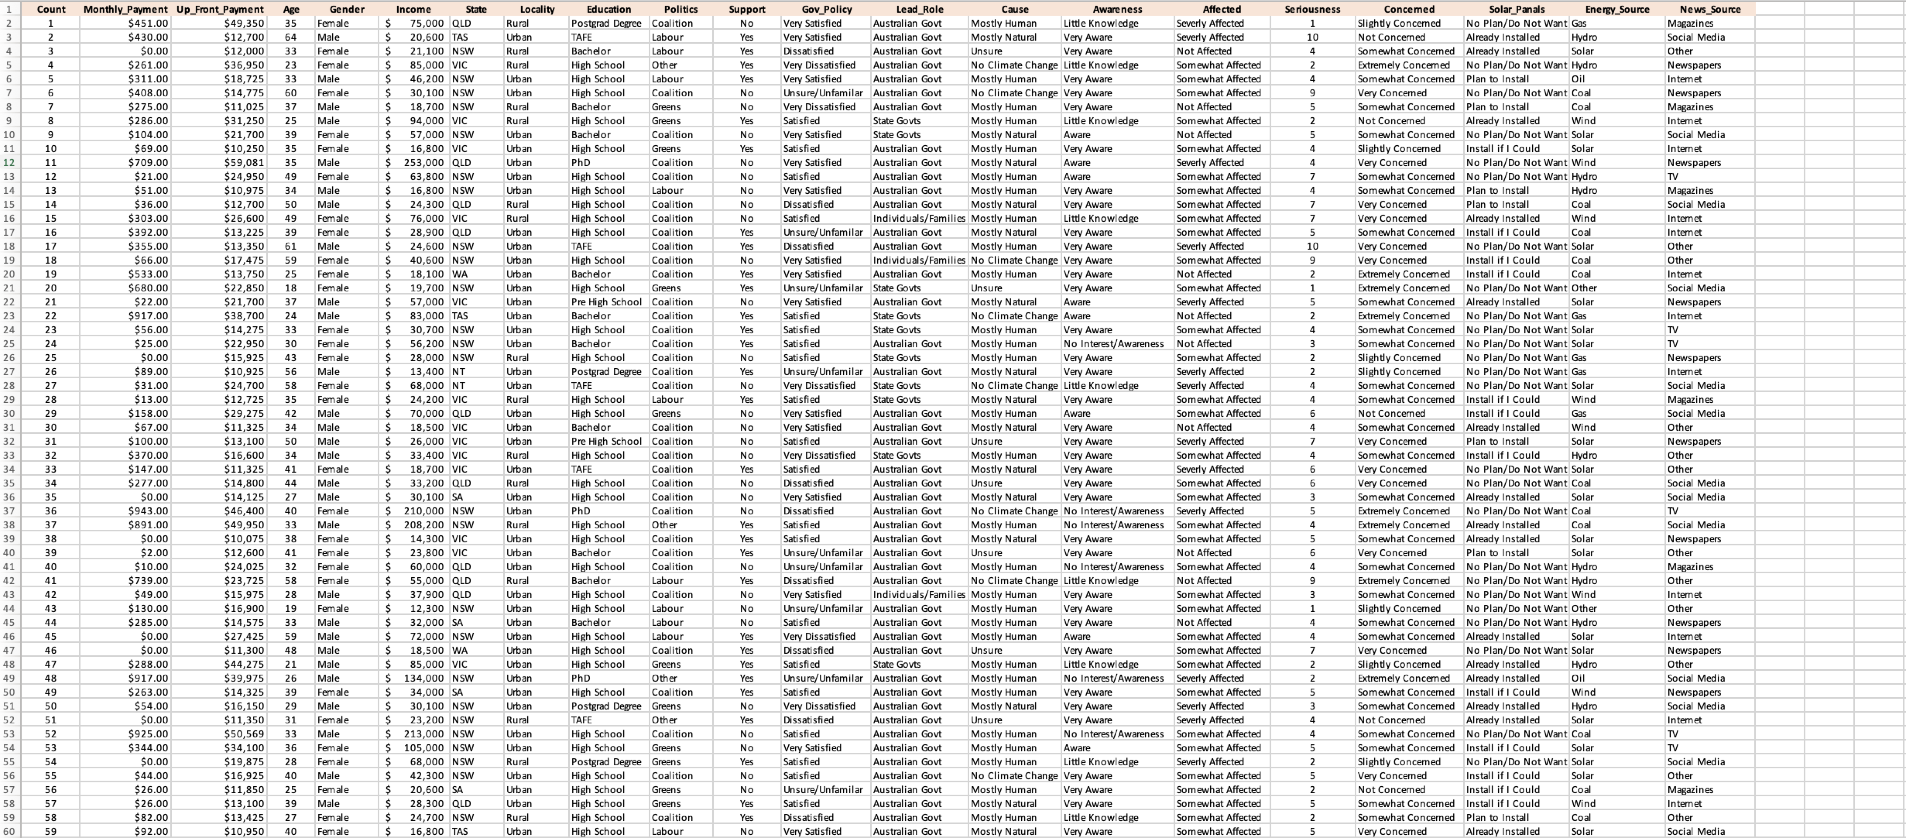
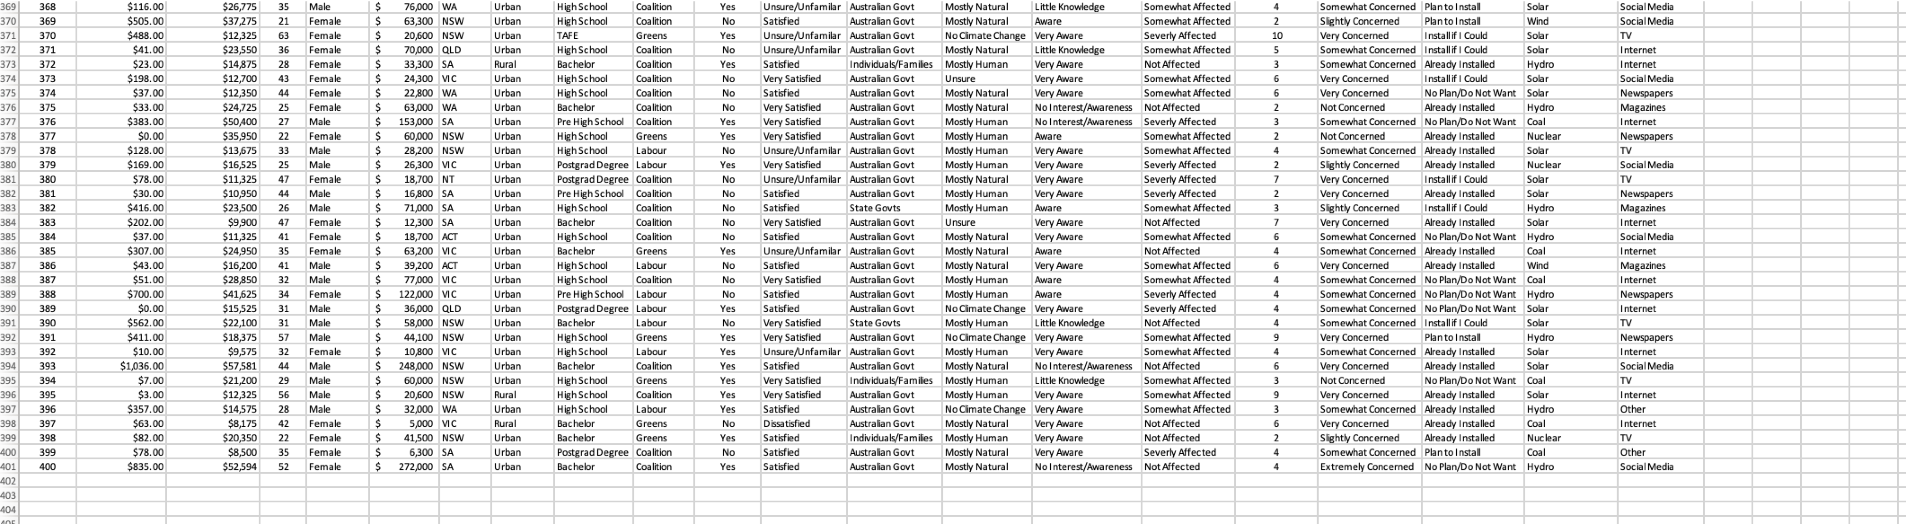
I have the following questions/issues relating to the NetZero attitude dataset.
1. Is there a willingness among urban residents to pay higher monthly payments for achieving net-zero electricity bills compared to their rural counterparts?
2. Is the proportion of residents who are not concerned about climate change lower in rural areas compared to urban areas?
3. Does the proportion of residents who believe that Australia should financially support developing countries in their support efforts to address climate change differ across their political beliefs?
4. Does the average upfront amount for achieving net-zero electricity bills significantly differ across who they think should take responsibility in addressing climate change?
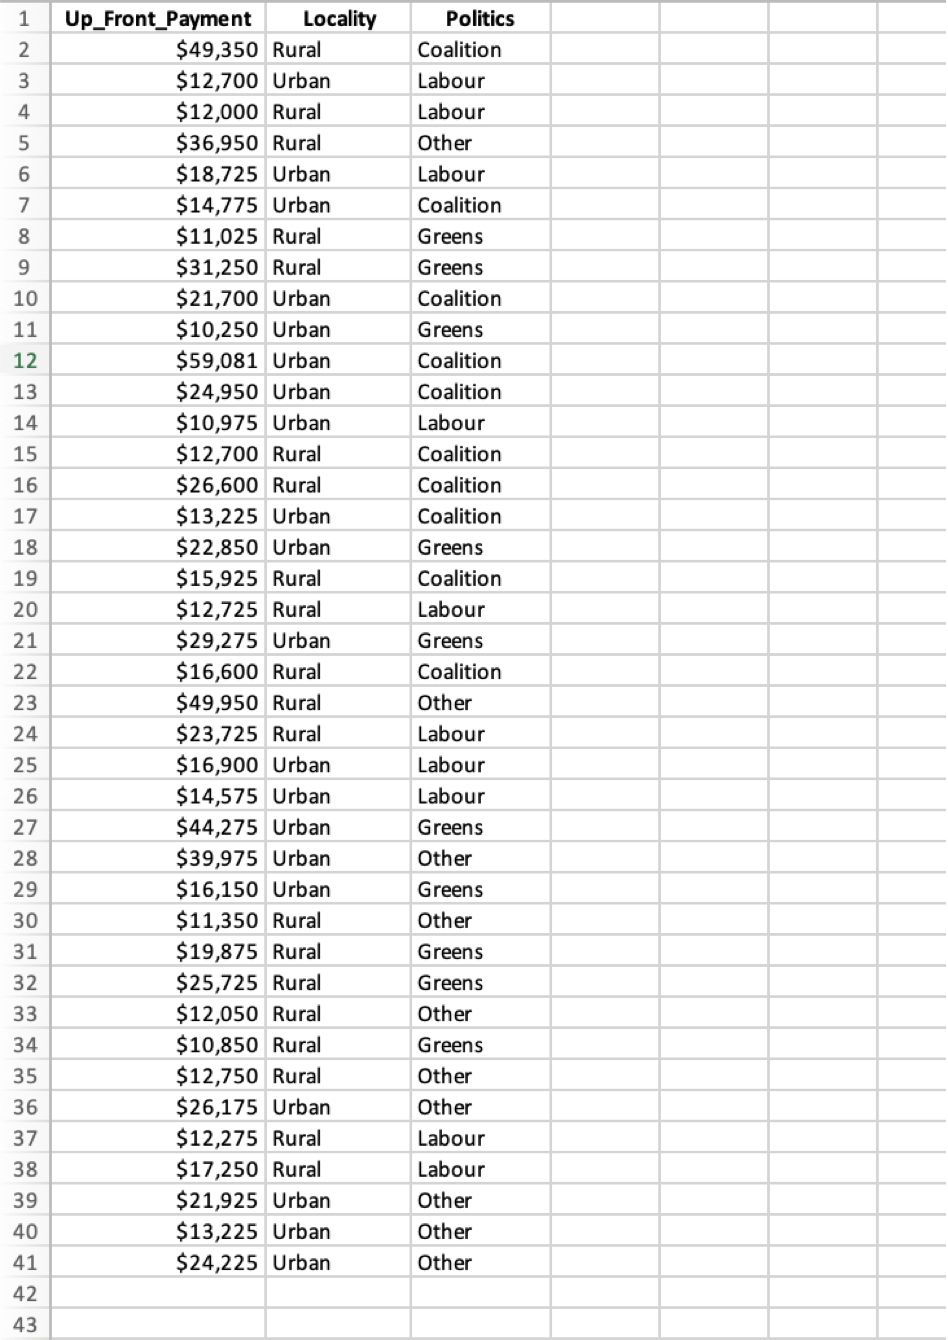
5. Design an experiment to see the impact of locality and political affiliation on the amount willing to pay upfront for achieving net-zero electricity bills.
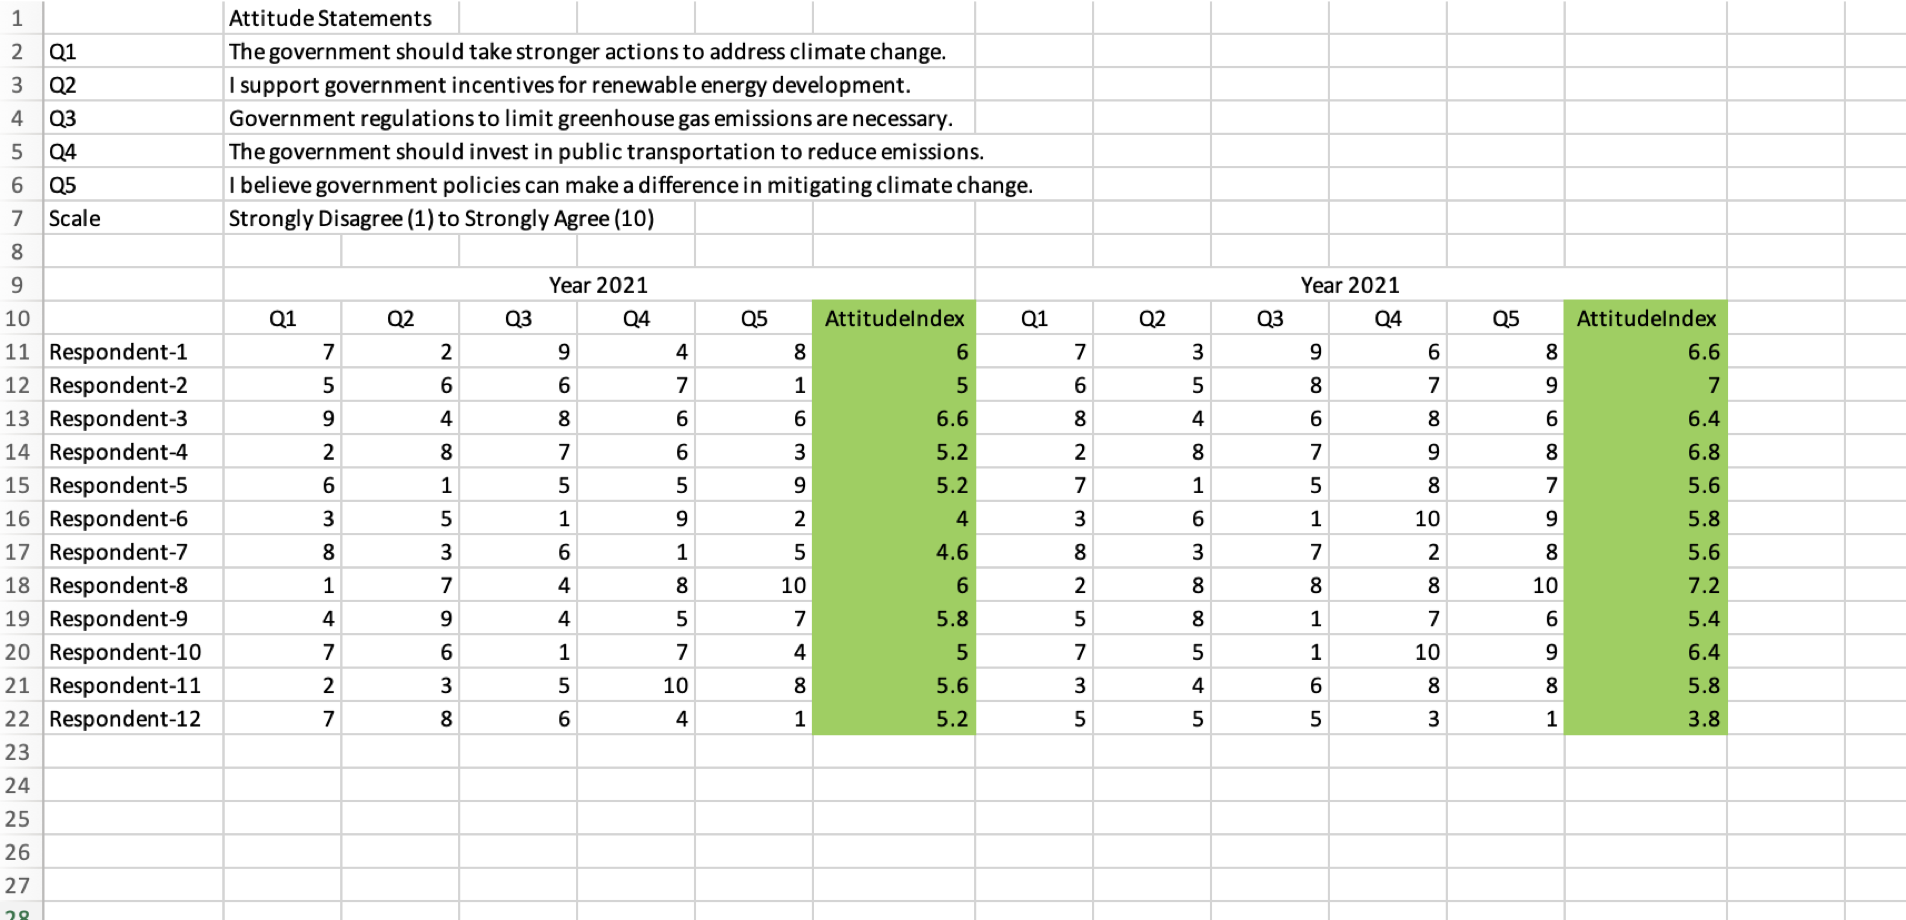
6. A study was conducted to evaluate the attitudes of 12 randomly selected residents towards the government's approach to climate change. An Attitude Index was used to measure the level of support for the government's approach, where higher values indicated greater support. The residents participated in the study in both 2021 and 2022. Is there a change in the attitude?
THE data analysis using the Excel templates provided in practicals. In choosing the technique to apply for a given question, keep the following in mind: ? Are we dealing with a numerical variable or a categorical variable? ? Are we dealing with one population, two populations or more than two populations? ? Are we dealing with an independent population or a dependent population? ? Each question must be answered using the most appropriate technique(s) and justify the decision where applicable. ? Please formulate the hypotheses, and state them clearly in both notation and words in the Excel file. ? Even though a question(s) lead you to inferential techniques, consider conducting a descriptive analysis of the data first. For all questions , assume that: ? 95 % confidence level is appropriate for confidence intervals and; ? 5.0 % level of significance (i.e. ? = 0.05) is appropriate for any hypothesis tests


Expert Answer:


Financial Accounting and Reporting
ISBN: 978-0273744443
14th Edition
Authors: Barry Elliott, Jamie Elliott
