

Question: I have these numbers based on some data. if they were to be made into a regression equation and made into a graph into desmos
I have these numbers based on some data. if they were to be made into a regression equation and made into a graph into desmos how would the graph look like for both of the equations?
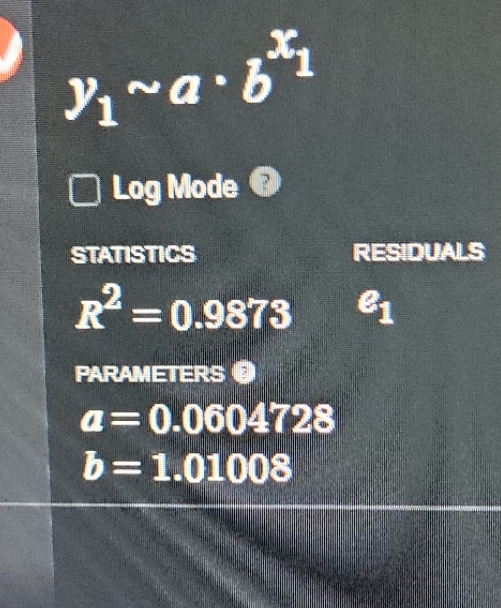
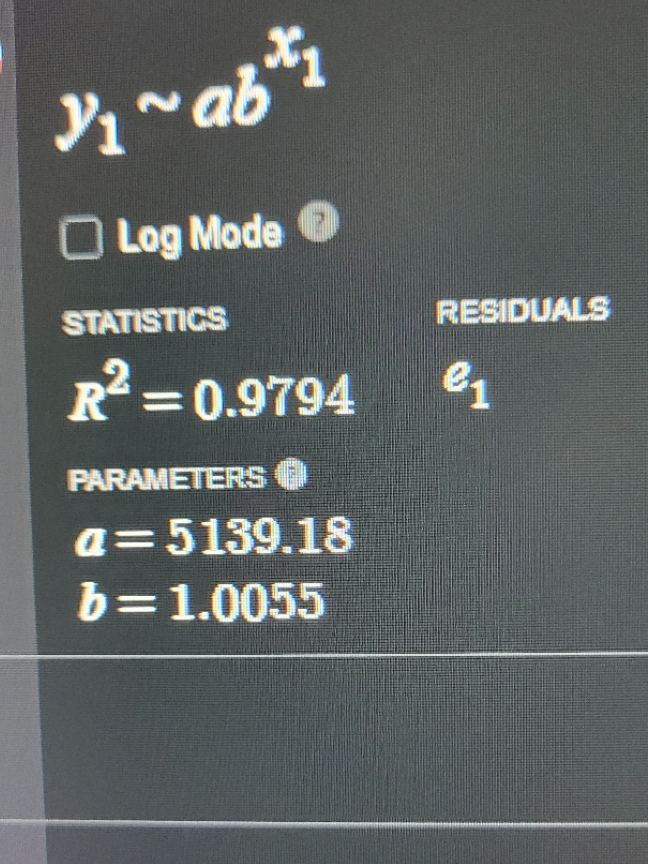
Vi~a. bi OLog Mode STATISTICS RESIDUALS R = 0.9873 e1 PARAMETERS a= 0.0604728 b =1.01008X1 y ~ ab O Log Mode STATISTICS RESIDUALS R- =0.9794 e1 PARAMETERS a= 5139.18 b = 1.0055
Step by Step Solution
There are 3 Steps involved in it
1 Expert Approved Answer
Step: 1 Unlock

Question Has Been Solved by an Expert!
Get step-by-step solutions from verified subject matter experts
Step: 2 Unlock
Step: 3 Unlock