

Question: I have to code this in MATlab. I got the first plot to work but dont know how to do the optimization on the second
I have to code this in MATlab. I got the first plot to work but dont know how to do the optimization on the second part. Please comment the code so I understand what's going on.
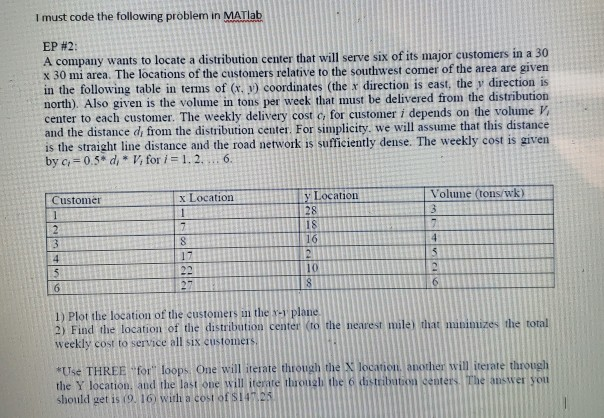
I must code the following problem in MATIab EP #2: A company wants to locate a distribution center that will serve six of its major customers in a 30 x 30 mi area. The locations of the customers relative to the southwest comer of the area are given in the following table in terms of (r. ) coordinates (the x direction is east, the y direction is north). Also given is the volume in tons per week that must be delivered from the distribution center to each customer. The weekly delivery cost e, for customer i depends on the vohme and the distance di from the distribution center. For simplicity, we will assume that this distance an by ci 0.5* di Vi for i1.2.6 is the straight line distance and the road network is sufficiently dense. The weekly cost is given x Location y Locationn Volune (tons/wk Customer 18 16 17 10 l) Plot the location of the customers im the plane 2) Find the location of the distribution center (to the nearest mile ac ipinizes the totul weekly cost to service all sis customers Use THREE for loops One will iterate through the Jocanon, anodher wil iterate through the Y location, and the last one will iterare uough tbe 6 dbstrabatson ceoter should get is o. 16 with a cot of $1472s
Step by Step Solution
There are 3 Steps involved in it

Get step-by-step solutions from verified subject matter experts