

Question: I have to create a set of tables using data from excel. Their is a zip folder of multiple excel tables worth of data. I
I have to create a set of tables using data from excel. Their is a zip folder of multiple excel tables worth of data. I need to get the data from all the excel files and make a table using python. I have attached an image of a sample of the data. I have also attached a pic of the questions i need to solve. So I just need to know how to write some code in python that takes all the data from the all the excel tables and filter that data. Thanks
 This is the problem I need to solve.
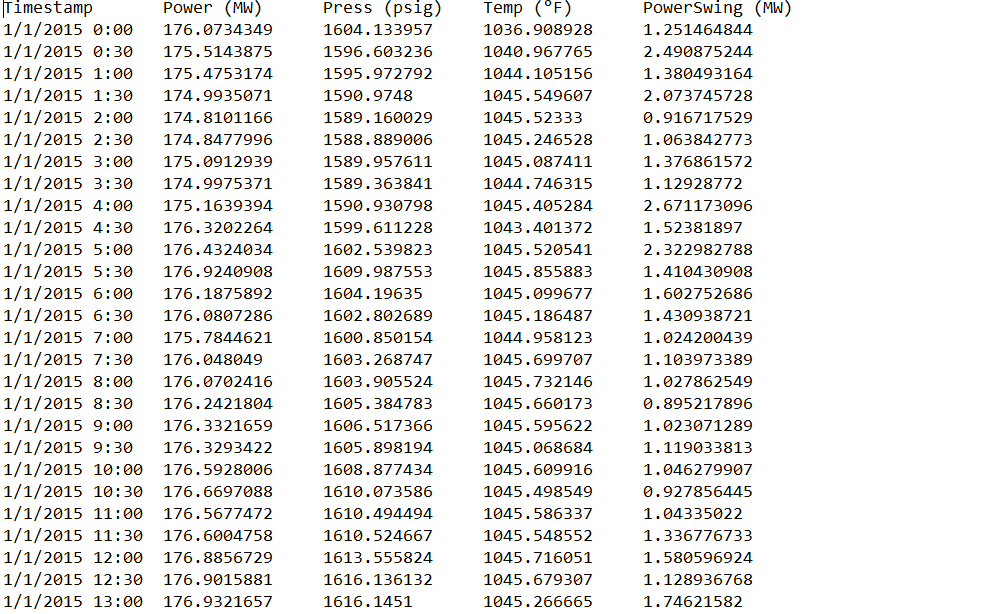
This is a sample of the data
 Due On November 5th
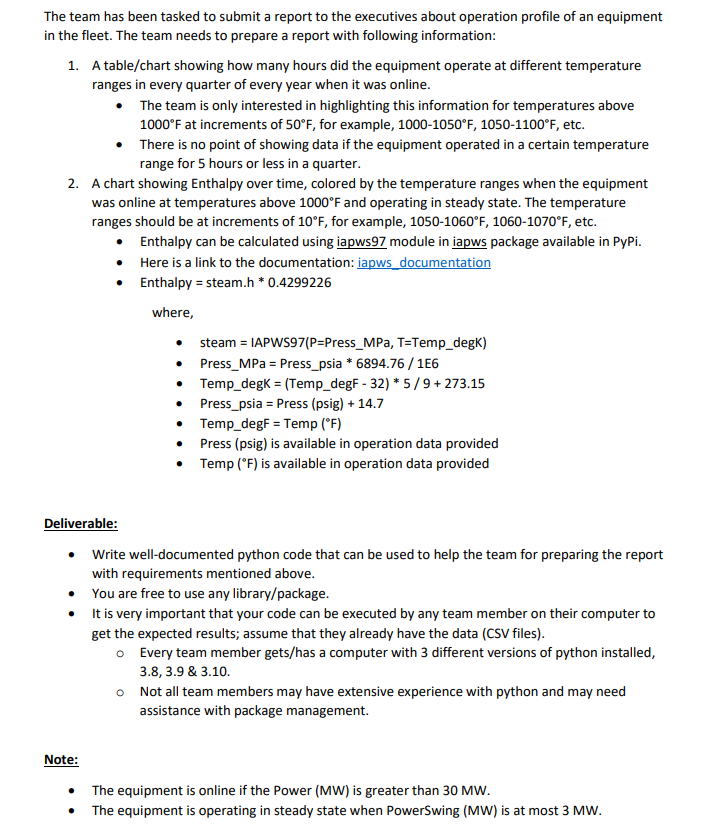
The team has been tasked to submit a report to the executives about operation profile of an equipment in the fleet. The team needs to prepare a report with following information: 1. A table/chart showing how many hours did the equipment operate at different temperature ranges in every quarter of every year when it was online. - The team is only interested in highlighting this information for temperatures above 1000F at increments of 50F, for example, 10001050F,10501100F, etc. - There is no point of showing data if the equipment operated in a certain temperature range for 5 hours or less in a quarter. 2. A chart showing Enthalpy over time, colored by the temperature ranges when the equipment was online at temperatures above 1000F and operating in steady state. The temperature ranges should be at increments of 10F, for example, 10501060F,10601070F, etc. - Enthalpy can be calculated using iapws 97 module in iapws package available in PyPi. - Here is a link to the documentation: iapws documentation - Enthalpy = steam.h * 0.4299226 where, - steam = IAPWS97(P=Press_MPa, T=Temp_degK) - Press_MPa = Press_psia * 6894.76 / 1E6 - Temp_degK =( Temp_degF 32)5/9+273.15 - Press_psia = Press (psig) + 14.7 - Temp_degF =Temp(F) - Press (psig) is available in operation data provided - Temp (F) is available in operation data provided Deliverable: - Write well-documented python code that can be used to help the team for preparing the report with requirements mentioned above. - You are free to use any library/package. - It is very important that your code can be executed by any team member on their computer to get the expected results; assume that they already have the data (CSV files). - Every team member gets/has a computer with 3 different versions of python installed, 3.8,3.9 \& 3.10. - Not all team members may have extensive experience with python and may need assistance with package management. Note: - The equipment is online if the Power (MW) is greater than 30MW. - The equipment is operating in steady state when PowerSwing (MW) is at most 3MW. Timestamp1/1/20151/1/20151/1/20151/1/20151/1/20151/1/20151/1/20151/1/20151/1/20151/1/20151/1/20151/1/20151/1/20151/1/20151/1/20151/1/20151/1/20151/1/20151/1/20151/1/20151/1/20151/1/20151/1/20151/1/20151/1/20151/1/2015Power(MW)0:000:301:001:302:002:303:003:304:004:305:005:306:006:307:007:308:008:309:009:3010:0010:3011:0011:3012:0012:30Press(psig)176.0734349175.5143875175.4753174174.9935071174.8101166174.8477996175.0912939174.9975371175.1639394176.3202264176.4324034176.9240908176.1875892176.0807286175.7844621176.048049176.0702416176.2421804176.3321659176.3293422176.5928006176.6697088176.5677472176.6004758176.8856729176.9015881Temp(F)1604.1339571596.6032361595.9727921590.97481589.1600291588.8890061589.9576111589.3638411590.9307981599.6112281602.5398231609.9875531604.196351602.8026891600.8501541603.2687471603.9055241605.3847831606.5173661605.8981941608.8774341610.0735861610.4944941610.5246671613.5558241616.136132PowerSwing(1036.9089281040.9677651044.1051561045.5496071045.523331045.2465281045.0874111044.7463151045.4052841043.4013721045.5205411045.8558831045.0996771045.1864871044.9581231045.6997071045.7321461045.6601731045.5956221045.0686841045.6099161045.4985491045.5863371045.5485521045.7160511.2514648442.4908752441.3804931642.0737457280.9167175291.0638427731.3768615721.129287722.6711730961.523818972.3229827881.4104309081.6027526861.4309387211.0242004391.1039733891.0278625490.8952178961.0230712891.1190338131.0462799070.9278564451.043350221.3367767331.580596924 The team has been tasked to submit a report to the executives about operation profile of an equipment in the fleet. The team needs to prepare a report with following information: 1. A table/chart showing how many hours did the equipment operate at different temperature ranges in every quarter of every year when it was online. - The team is only interested in highlighting this information for temperatures above 1000F at increments of 50F, for example, 10001050F,10501100F, etc. - There is no point of showing data if the equipment operated in a certain temperature range for 5 hours or less in a quarter. 2. A chart showing Enthalpy over time, colored by the temperature ranges when the equipment was online at temperatures above 1000F and operating in steady state. The temperature ranges should be at increments of 10F, for example, 10501060F,10601070F, etc. - Enthalpy can be calculated using iapws 97 module in iapws package available in PyPi. - Here is a link to the documentation: iapws documentation - Enthalpy = steam.h * 0.4299226 where, - steam = IAPWS97(P=Press_MPa, T=Temp_degK) - Press_MPa = Press_psia * 6894.76 / 1E6 - Temp_degK =( Temp_degF 32)5/9+273.15 - Press_psia = Press (psig) + 14.7 - Temp_degF =Temp(F) - Press (psig) is available in operation data provided - Temp (F) is available in operation data provided Deliverable: - Write well-documented python code that can be used to help the team for preparing the report with requirements mentioned above. - You are free to use any library/package. - It is very important that your code can be executed by any team member on their computer to get the expected results; assume that they already have the data (CSV files). - Every team member gets/has a computer with 3 different versions of python installed, 3.8,3.9 \& 3.10. - Not all team members may have extensive experience with python and may need assistance with package management. Note: - The equipment is online if the Power (MW) is greater than 30MW. - The equipment is operating in steady state when PowerSwing (MW) is at most 3MW. Timestamp1/1/20151/1/20151/1/20151/1/20151/1/20151/1/20151/1/20151/1/20151/1/20151/1/20151/1/20151/1/20151/1/20151/1/20151/1/20151/1/20151/1/20151/1/20151/1/20151/1/20151/1/20151/1/20151/1/20151/1/20151/1/20151/1/2015Power(MW)0:000:301:001:302:002:303:003:304:004:305:005:306:006:307:007:308:008:309:009:3010:0010:3011:0011:3012:0012:30Press(psig)176.0734349175.5143875175.4753174174.9935071174.8101166174.8477996175.0912939174.9975371175.1639394176.3202264176.4324034176.9240908176.1875892176.0807286175.7844621176.048049176.0702416176.2421804176.3321659176.3293422176.5928006176.6697088176.5677472176.6004758176.8856729176.9015881Temp(F)1604.1339571596.6032361595.9727921590.97481589.1600291588.8890061589.9576111589.3638411590.9307981599.6112281602.5398231609.9875531604.196351602.8026891600.8501541603.2687471603.9055241605.3847831606.5173661605.8981941608.8774341610.0735861610.4944941610.5246671613.5558241616.136132PowerSwing(1036.9089281040.9677651044.1051561045.5496071045.523331045.2465281045.0874111044.7463151045.4052841043.4013721045.5205411045.8558831045.0996771045.1864871044.9581231045.6997071045.7321461045.6601731045.5956221045.0686841045.6099161045.4985491045.5863371045.5485521045.7160511.2514648442.4908752441.3804931642.0737457280.9167175291.0638427731.3768615721.129287722.6711730961.523818972.3229827881.4104309081.6027526861.4309387211.0242004391.1039733891.0278625490.8952178961.0230712891.1190338131.0462799070.9278564451.043350221.3367767331.580596924
Step by Step Solution
There are 3 Steps involved in it

Get step-by-step solutions from verified subject matter experts