

Question: I have to present this slides so what I need from you is basically explain them like if you were the speaker. Regarding the graphs
I have to present this slides so what I need from you is basically explain them like if you were the speaker. Regarding the graphs that are on the slide you have to explain what they represent providing examples about companies/situations/products that can represent that.
Examples reinforcing the explanation are really appreciated.
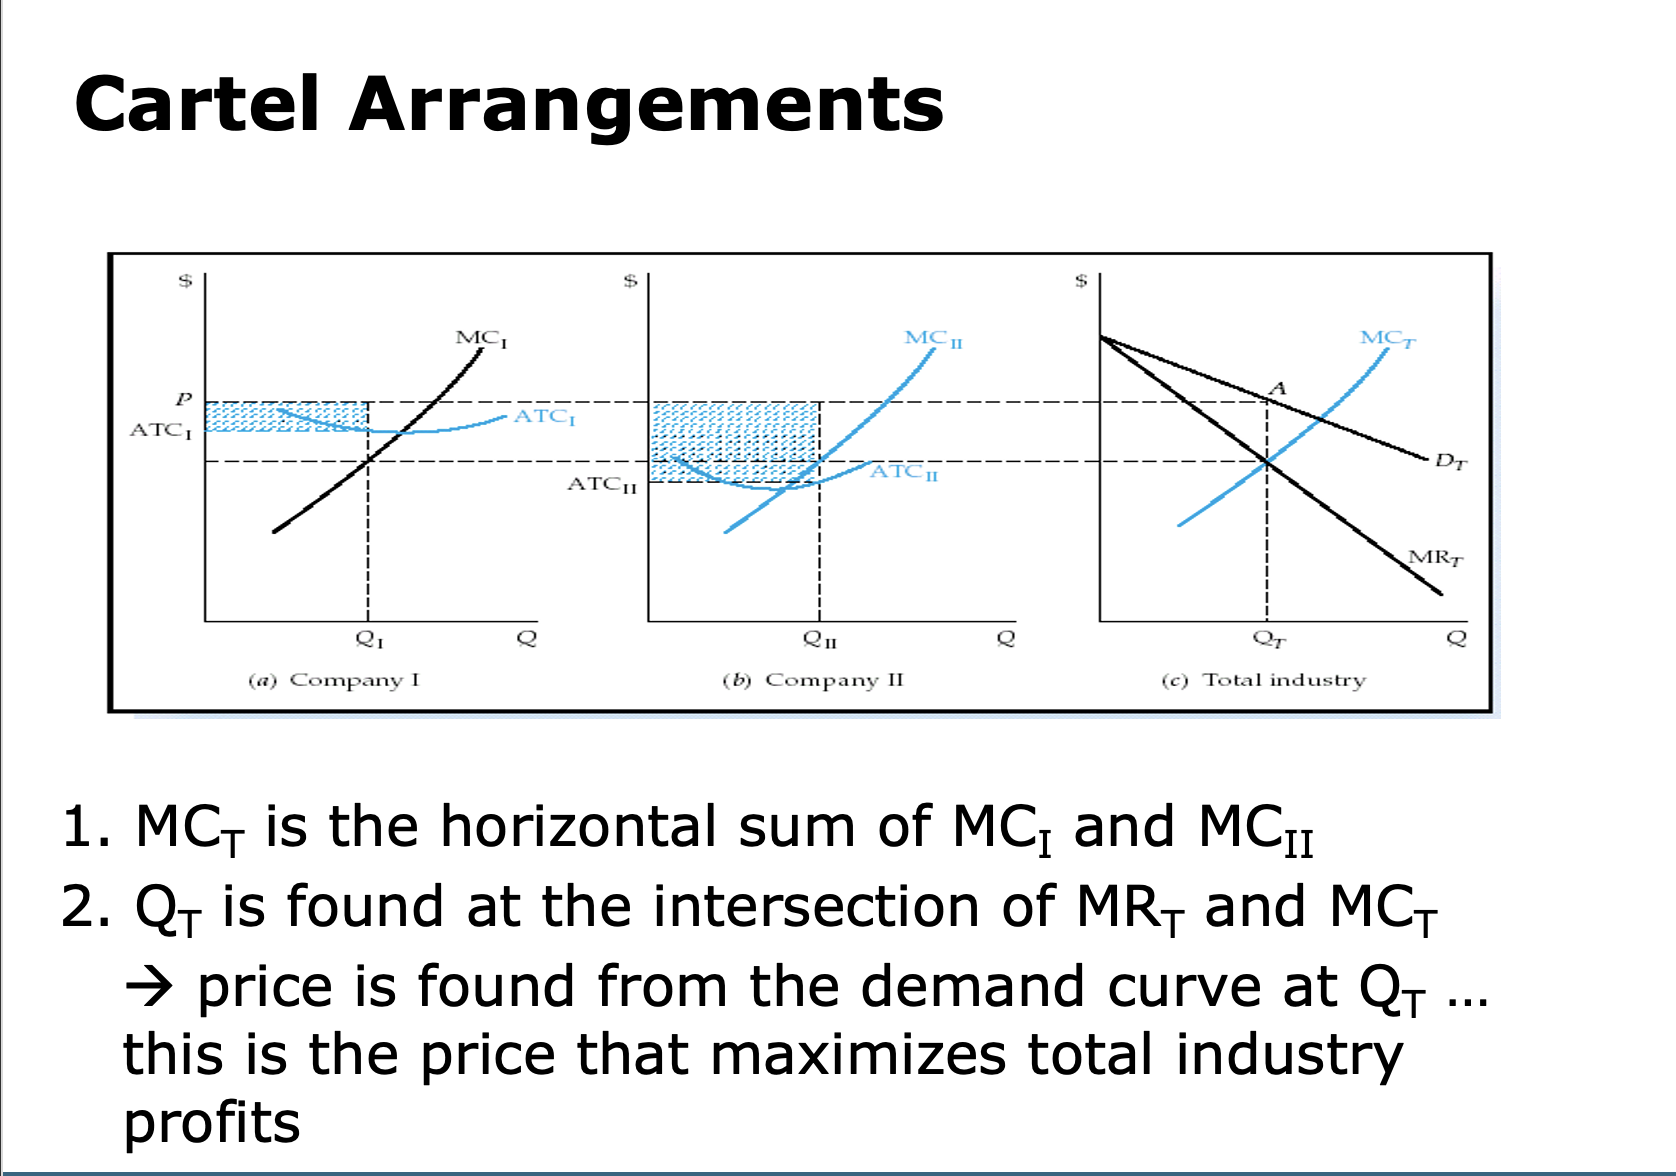
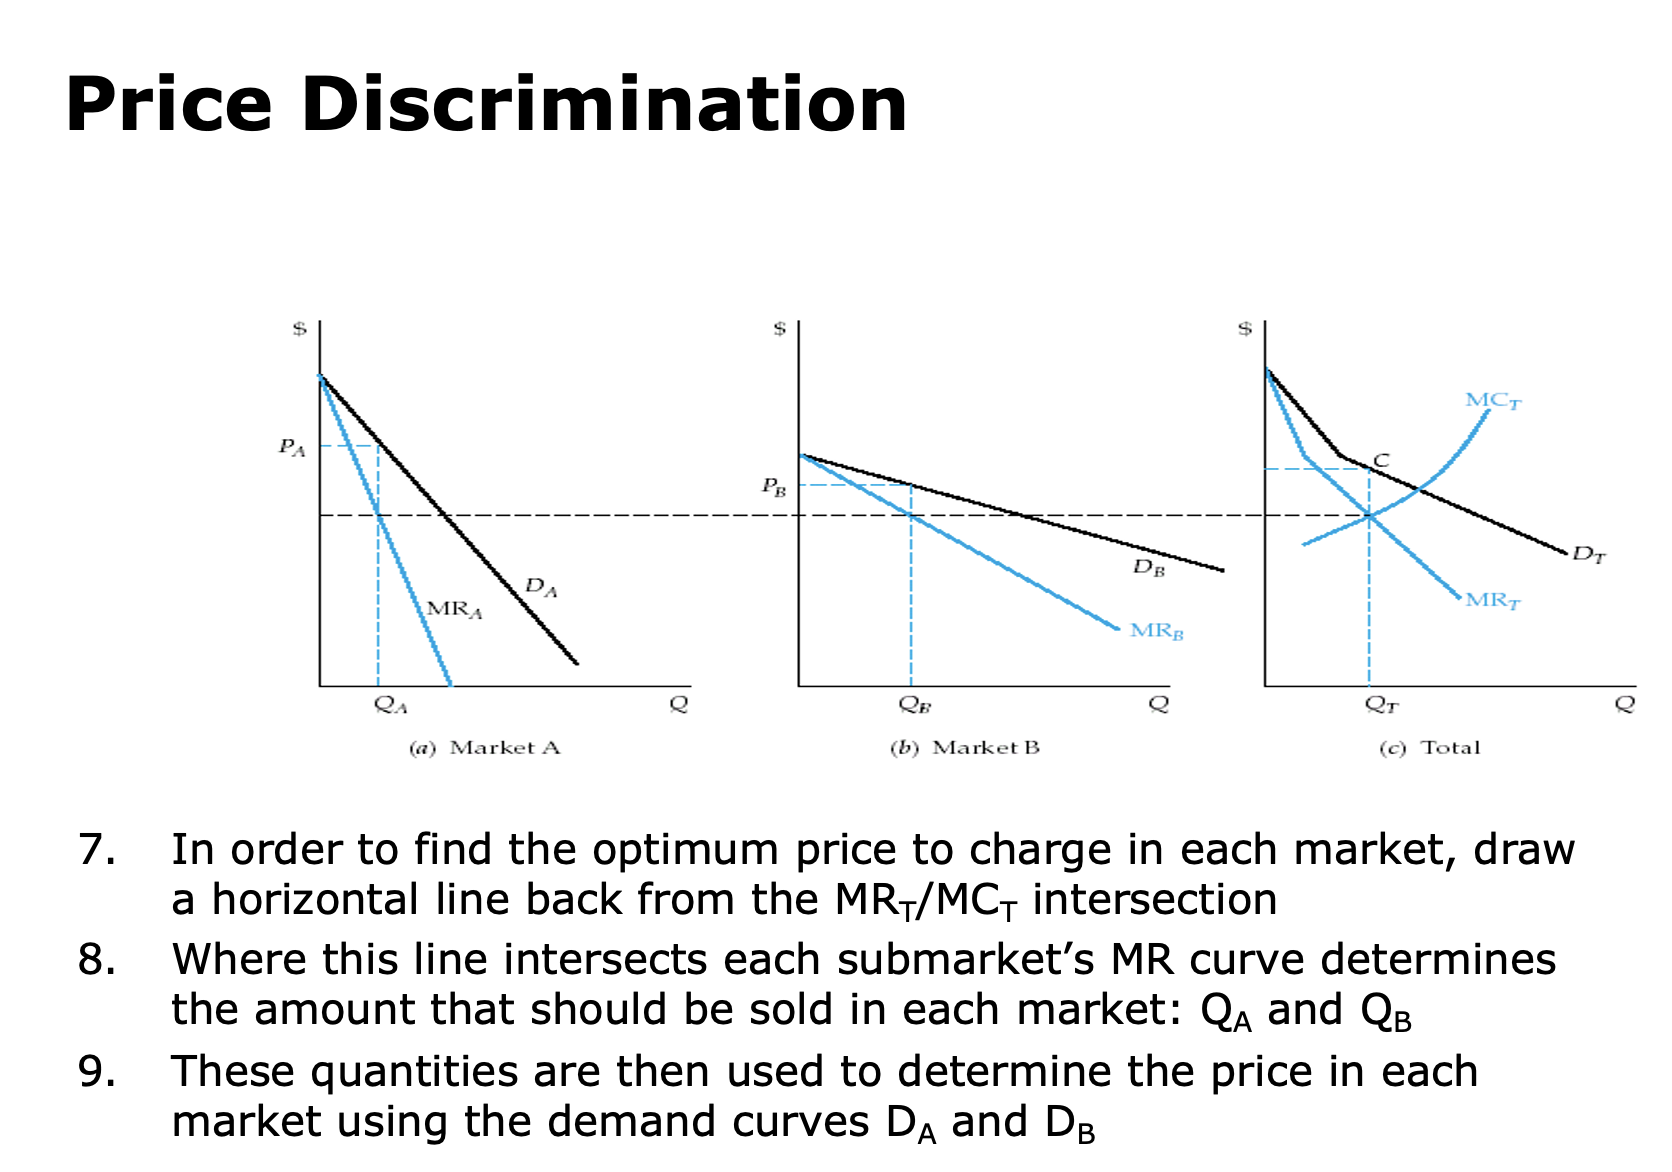
Cartel Arrangements MCI MC II MCT P - ATCI ATCI - DT ATCII ATCHI MRT 21 Q QT Q (a) Company I (b) Company II (c) Total industry 1. MC, is the horizontal sum of MC, and MCII 2. QT is found at the intersection of MRT and MCT > price is found from the demand curve at QT ... this is the price that maximizes total industry profitsPrice Discrimination $ $ MCT PA PB DT DB MRT DA MRB MRA Q QT Q QB (c) Total QA (b) Market B (a) Market A 7. In order to find the optimum price to charge in each market, draw a horizontal line back from the MRT/MCT intersection 8. Where this line intersects each submarket's MR curve determines the amount that should be sold in each market: QA and QB 9. These quantities are then used to determine the price in each market using the demand curves DA and DBGame Theory Economic optimization has two shortcomings when applied to actual business situations assumes factors such as reaction of competitors or tastes and preferences of consumers remain constant managers sometimes make decisions when other parties have more information about market conditions Asymmetric Information . Example - Adverse selection - 'lemons' (bad used cars): seller knows the vehicle well, but buyer does not
Step by Step Solution
There are 3 Steps involved in it

Get step-by-step solutions from verified subject matter experts