

Question: I have to solve this question using the given data. (The risk free rate s 3.00% APR). I'm not sure where to start. Optimal Complete
I have to solve this question using the given data. (The risk free rate s 3.00% APR). I'm not sure where to start. 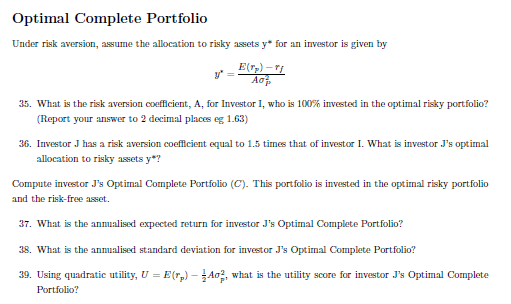
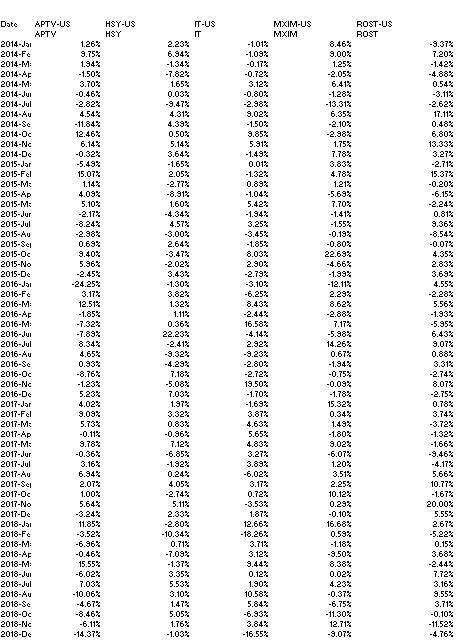
Optimal Complete Portfolio Under risk aversion, assume the allocation to risky assets y* for an investor is given by E(Tp) - Ao 35. What is the risk aversion coefficient, A, for Investor I, who is 100% invested in the optimal risky portfolio? (Report your answer to 2 decimal places eg 1.63) 36. Investor J has a risk aversion coefficient equal to 1.5 times that of investor I. What is investor J's optimal allocation to risky assets y*? Compute investor J's Optimal Complete Portfolio (C). This portfolio is invested in the optimal risky portfolio and the risk-free set. 37. What is the annualised expected return for investor J's Optimal Complete Portfolio? 38. What is the annualised standard deviation for investor J's Optimal Complete Portfolio? 39. Using quadratic utility, U = E(Tp) - 40, what is the utility score for investor J's Optimal Complete Portfolio IT-US IT MXIM-US MXIM ROST-US ROST -9.37% 7.20% -1.42% -4,88% 0.542 -3.11% -2.62% 17.11% 0.48% 6.80% 13.33% 3.27% -2.71% 15.37% -0.20% -6.15% -2.24% 0.81% 9.36% -8.54% -0.07% Date APTV-US HSY-US APTV HSY 2014-Jal 1.26% 2014-F 9.75% 2014-M: 1.94% 2014 - -1.50% 2014-M: 3.70% 2014-JUI -0.46% 2014-Jul -2.82% 2014-Au 4.543 2014-SC - 11.84% 2014 405 12.46% 2014-Nc 6.14% 2014-Da -0.32% 2015-Jar -5.49% 2015-F 15.07% 2015-M: 1.14% 2015-AP 4.09% 2015-M 5.10% 2015-Jur -2.17% 2015-Jul -8.24% 2015-Au -2.98% 2015-SC 0.69% 2015-OC 9.40% 2015-No 5.963 2015-De -2.45% 2016-Joi -24.25% 2016-F 3.17% 2016-MI 12.512 2016-AF -1.85% 2016-M -7.32% 2016-JUI -7.89% 2016-Jul 2016-Au 4.65% 2016-Sc 0.93% 2016-OC -8.763 2016-NC -1.23% 2016-04 5.23% 2017-Jar 4.02% 2017-Fel 9.09% 2017-M 5.73% 2017-AP -0.11% 2017-M5 9.78% 2017-Jur -0.36% 2017-Jul 3.162 2017-AU 6.943 2017-S1 2.07% 2017-OC 1.002 2017-No 5.64% 2017-De -3.24% 2018-Jai 11.85% 2018-FC -3.52% 2018-M -6.96% 2018-AF -0.46% 2018-M 15.55% 2018-JUI -6.02% 2018-Jul 7.03% 2018-AU -10.06% 2018-36 -4.67% 2016-08 -8.46% 2018-Nc -6.11% 2013-D -14.37% 2.23% 6.94% -1.34% -7.82% 1.65% 0.03% -9.47% 4.31% 4.39% 0.50% 5.14% 3.64% -1.65% 2.052 -2.77% -8.91% 1.60% -4.34% 4.57% -3.00% 2.643 -3.47% -2.02% 3.43% -1.302 3.82% 1.32% 1.11% 0.36% 22.23% -2.41% -9.32% -4.29% 7.18% -5.08% 7.03% 1.97% 3.32% 0.63% -0.36% 7.12% -6.85% -1.92% 0.24% 4.05% -2.74% 5.11% 2.332 -2.80% -10.34% 0.71% -7.092 -1.37% 3.35% 5.53% 3.10% 1.47% 5.05% 1.76% -1.03% -1.01% -1.092 -0.17% -0.72% 3.12% -0.80% -2.98% 9.02% -1.50% 9.85% 5.31% -1.49% 0.01% -1.32% 0.89% -1.04% 5.42% -1.943 3.25% -3.45% -1.85% 8.03% 2.902 -2.79% -3.10 -6.25% 8.432 -2.44% 16.58% -4.14% 2.922 -9.23% -2.80% -2.72% 19.50% -1.70% -1.692 3.87% 4.63% 5.65% 4.83% 3.272 3.89% -6.02% 3.17% 0.72% -3.53% 1.87% 12.66% -18.26% 3.71% 3.12% 9.443 0.12% 1.90% 10.58% 5.843 -6.932 3.84% -16.55% 8.46% 9.00% 1.25% -2.053 6.412 -1.282 -13.31% 6.35% -2.10% -2.98% 1.75% 7.78% 3.83% 4.78% 1.21% -5.69% 7.70% -1.41% - 1.55% -0.19% -0.80% 22.63% -4.66% -1.99% - 12.11% 2.29% 8.62% -2.88% 7.17% -5.98% 14.26% 0.67% -1.943 -0.75% -0.09% -1.78% 15.32% 0.343 1.49% -1.802 9.02% -6.07% 1.20% 3.51% 2.252 10.12% 0.29% -0.10% 16.68% 0.59% -1.18% -9.50% 8.38% 0.02% 4.23% -0.37% -6.75% -11.30% 12.71% -9.07% 2.83% 3.69% 4.55% -2.28% 5.56% -1.93% -5.95% 6.43% 9.07% 0.88% 3.31% -2.74% 8.07% -2.75% 0.78% 3.74% -3.72% -1.32% -1.66% -9.46% 5.66% 10.77% -1.67% 20.00% 5.55% 2.67% -5.22% 0.15% 3.68% -2.44% 7.72% 3.16% 9.55% 3.71% -0.10% - 11.52% -4.76% Optimal Complete Portfolio Under risk aversion, assume the allocation to risky assets y* for an investor is given by E(Tp) - Ao 35. What is the risk aversion coefficient, A, for Investor I, who is 100% invested in the optimal risky portfolio? (Report your answer to 2 decimal places eg 1.63) 36. Investor J has a risk aversion coefficient equal to 1.5 times that of investor I. What is investor J's optimal allocation to risky assets y*? Compute investor J's Optimal Complete Portfolio (C). This portfolio is invested in the optimal risky portfolio and the risk-free set. 37. What is the annualised expected return for investor J's Optimal Complete Portfolio? 38. What is the annualised standard deviation for investor J's Optimal Complete Portfolio? 39. Using quadratic utility, U = E(Tp) - 40, what is the utility score for investor J's Optimal Complete Portfolio IT-US IT MXIM-US MXIM ROST-US ROST -9.37% 7.20% -1.42% -4,88% 0.542 -3.11% -2.62% 17.11% 0.48% 6.80% 13.33% 3.27% -2.71% 15.37% -0.20% -6.15% -2.24% 0.81% 9.36% -8.54% -0.07% Date APTV-US HSY-US APTV HSY 2014-Jal 1.26% 2014-F 9.75% 2014-M: 1.94% 2014 - -1.50% 2014-M: 3.70% 2014-JUI -0.46% 2014-Jul -2.82% 2014-Au 4.543 2014-SC - 11.84% 2014 405 12.46% 2014-Nc 6.14% 2014-Da -0.32% 2015-Jar -5.49% 2015-F 15.07% 2015-M: 1.14% 2015-AP 4.09% 2015-M 5.10% 2015-Jur -2.17% 2015-Jul -8.24% 2015-Au -2.98% 2015-SC 0.69% 2015-OC 9.40% 2015-No 5.963 2015-De -2.45% 2016-Joi -24.25% 2016-F 3.17% 2016-MI 12.512 2016-AF -1.85% 2016-M -7.32% 2016-JUI -7.89% 2016-Jul 2016-Au 4.65% 2016-Sc 0.93% 2016-OC -8.763 2016-NC -1.23% 2016-04 5.23% 2017-Jar 4.02% 2017-Fel 9.09% 2017-M 5.73% 2017-AP -0.11% 2017-M5 9.78% 2017-Jur -0.36% 2017-Jul 3.162 2017-AU 6.943 2017-S1 2.07% 2017-OC 1.002 2017-No 5.64% 2017-De -3.24% 2018-Jai 11.85% 2018-FC -3.52% 2018-M -6.96% 2018-AF -0.46% 2018-M 15.55% 2018-JUI -6.02% 2018-Jul 7.03% 2018-AU -10.06% 2018-36 -4.67% 2016-08 -8.46% 2018-Nc -6.11% 2013-D -14.37% 2.23% 6.94% -1.34% -7.82% 1.65% 0.03% -9.47% 4.31% 4.39% 0.50% 5.14% 3.64% -1.65% 2.052 -2.77% -8.91% 1.60% -4.34% 4.57% -3.00% 2.643 -3.47% -2.02% 3.43% -1.302 3.82% 1.32% 1.11% 0.36% 22.23% -2.41% -9.32% -4.29% 7.18% -5.08% 7.03% 1.97% 3.32% 0.63% -0.36% 7.12% -6.85% -1.92% 0.24% 4.05% -2.74% 5.11% 2.332 -2.80% -10.34% 0.71% -7.092 -1.37% 3.35% 5.53% 3.10% 1.47% 5.05% 1.76% -1.03% -1.01% -1.092 -0.17% -0.72% 3.12% -0.80% -2.98% 9.02% -1.50% 9.85% 5.31% -1.49% 0.01% -1.32% 0.89% -1.04% 5.42% -1.943 3.25% -3.45% -1.85% 8.03% 2.902 -2.79% -3.10 -6.25% 8.432 -2.44% 16.58% -4.14% 2.922 -9.23% -2.80% -2.72% 19.50% -1.70% -1.692 3.87% 4.63% 5.65% 4.83% 3.272 3.89% -6.02% 3.17% 0.72% -3.53% 1.87% 12.66% -18.26% 3.71% 3.12% 9.443 0.12% 1.90% 10.58% 5.843 -6.932 3.84% -16.55% 8.46% 9.00% 1.25% -2.053 6.412 -1.282 -13.31% 6.35% -2.10% -2.98% 1.75% 7.78% 3.83% 4.78% 1.21% -5.69% 7.70% -1.41% - 1.55% -0.19% -0.80% 22.63% -4.66% -1.99% - 12.11% 2.29% 8.62% -2.88% 7.17% -5.98% 14.26% 0.67% -1.943 -0.75% -0.09% -1.78% 15.32% 0.343 1.49% -1.802 9.02% -6.07% 1.20% 3.51% 2.252 10.12% 0.29% -0.10% 16.68% 0.59% -1.18% -9.50% 8.38% 0.02% 4.23% -0.37% -6.75% -11.30% 12.71% -9.07% 2.83% 3.69% 4.55% -2.28% 5.56% -1.93% -5.95% 6.43% 9.07% 0.88% 3.31% -2.74% 8.07% -2.75% 0.78% 3.74% -3.72% -1.32% -1.66% -9.46% 5.66% 10.77% -1.67% 20.00% 5.55% 2.67% -5.22% 0.15% 3.68% -2.44% 7.72% 3.16% 9.55% 3.71% -0.10% - 11.52% -4.76%
Step by Step Solution
There are 3 Steps involved in it

Get step-by-step solutions from verified subject matter experts