

Question: I have trouble calculating the answer for this prompt. A public health official is studying differences in drinking habits among students at community colleges and
I have trouble calculating the answer for this prompt.
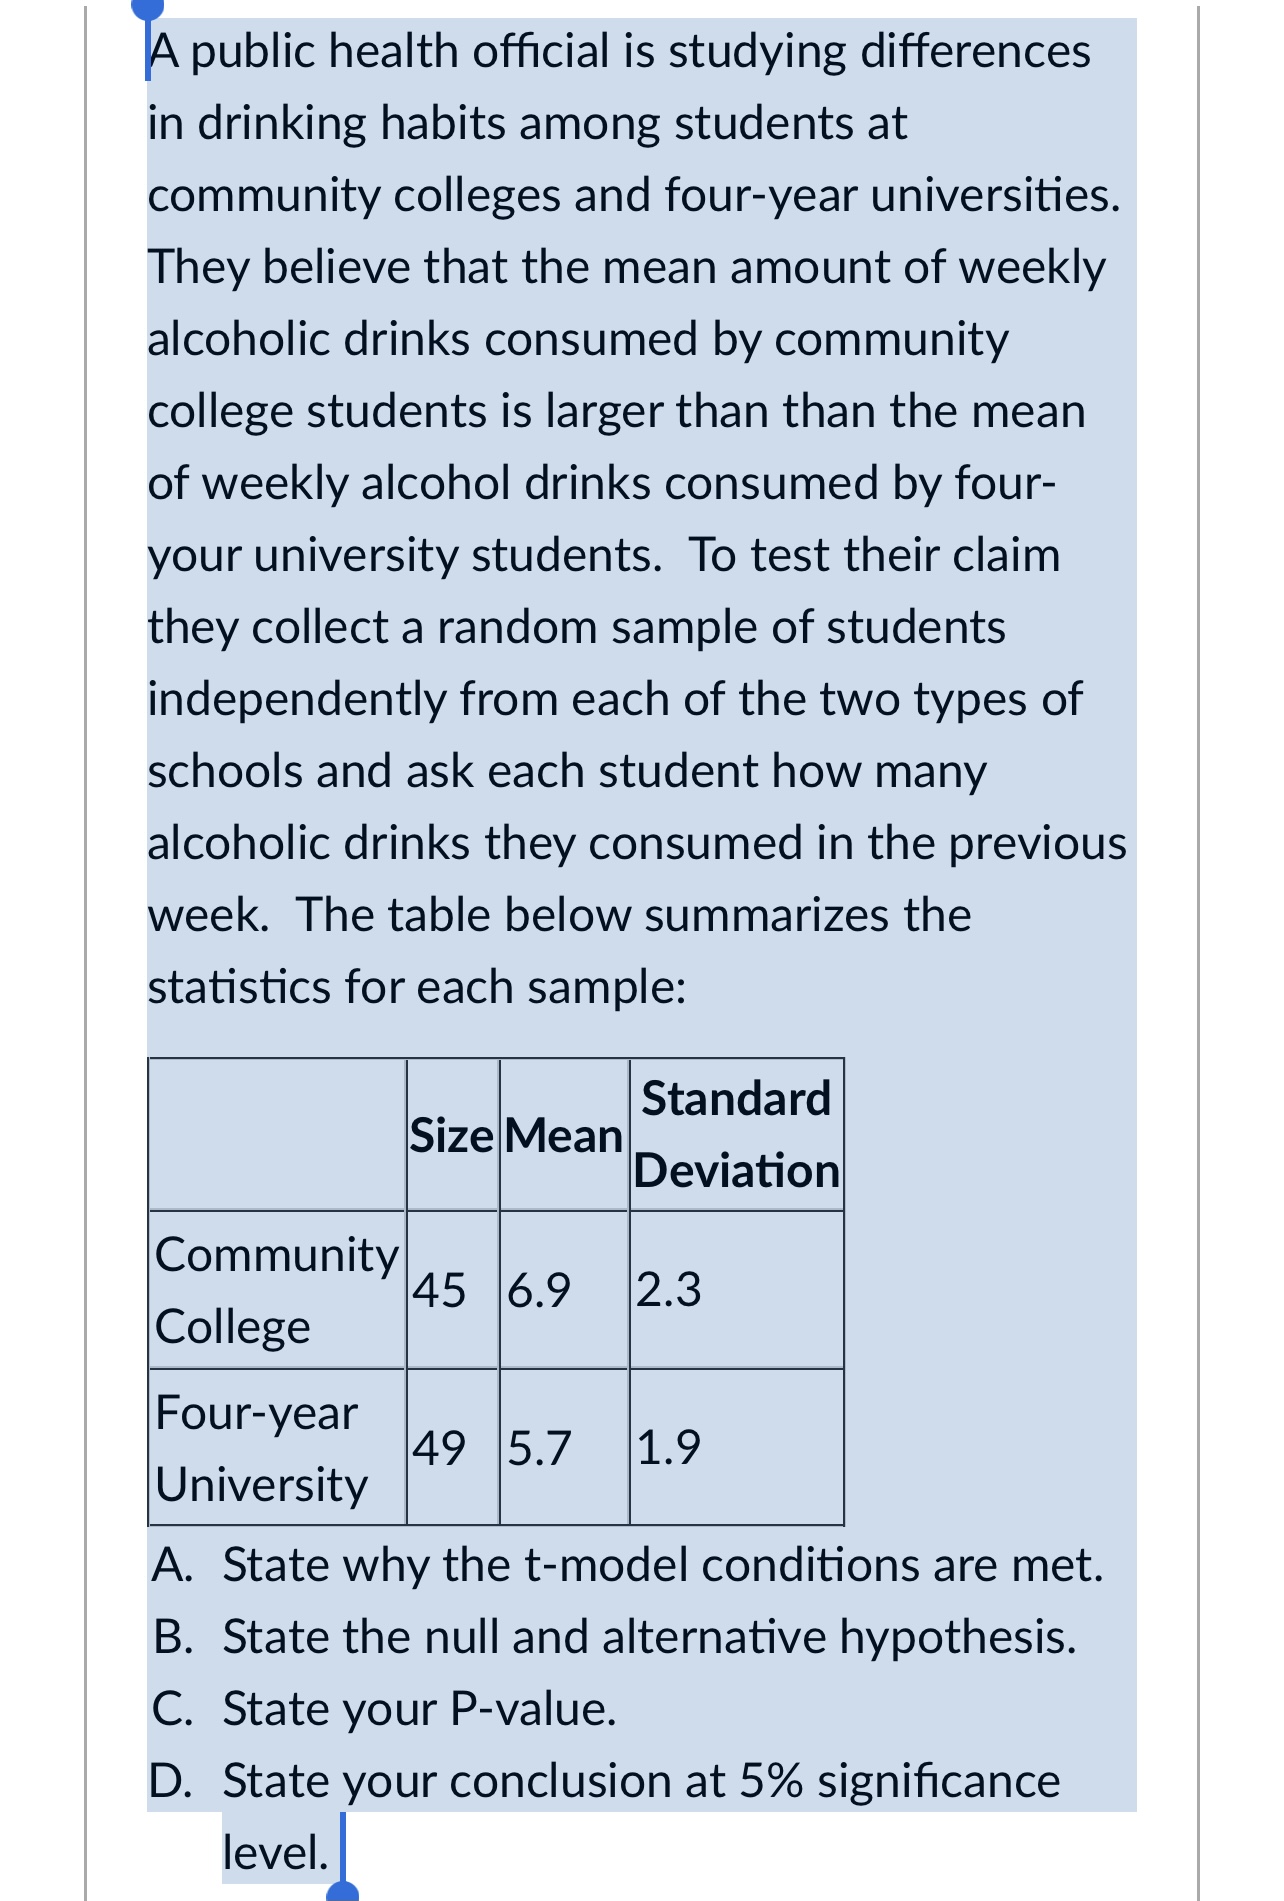
A public health official is studying differences in drinking habits among students at community colleges and four-year universities. They believe that the mean amount of weekly alcoholic drinks consumed by community college students is larger than than the mean of weekly alcohol drinks consumed by four- your university students. To test their claim they collect a random sample of students independently from each of the two types of schools and ask each student how many alcoholic drinks they consumed in the previous week. The table below summarizes the statistics for each sample: Standard Size Mean Deviation Community 45 6.9 12 .3 College Four-year 49 5.7 1.9 University A. State why the t-model conditions are met. B. State the null and alternative hypothesis. C. State your P-value. D. State your conclusion at 5% significance level
Step by Step Solution
There are 3 Steps involved in it

Get step-by-step solutions from verified subject matter experts