

Question: *****I just need the answer for patent and goodwill please***** Required: d. Now assume that during 2021, Karane decides to buy a competitor's assets for
*****I just need the answer for patent and goodwill please*****
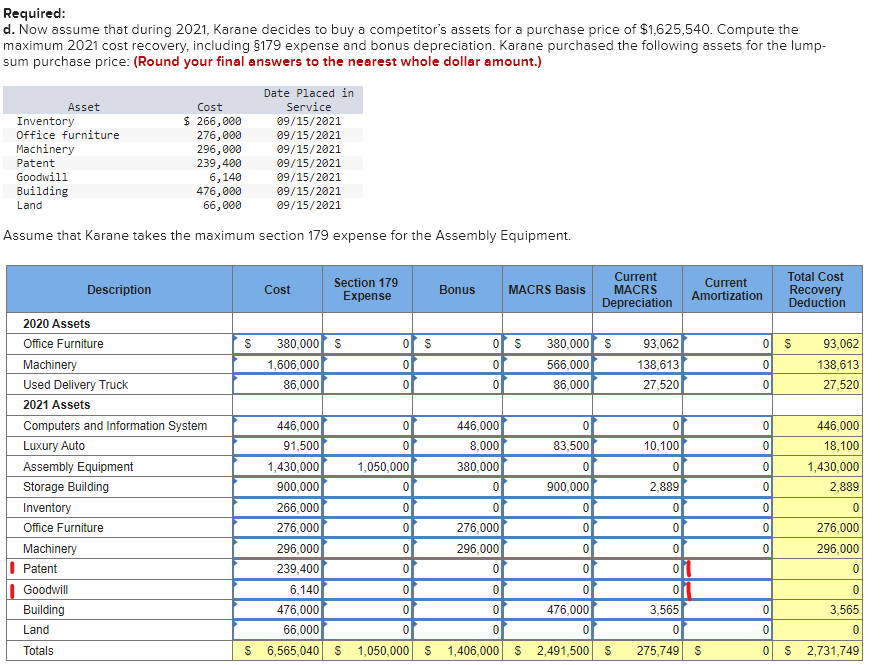
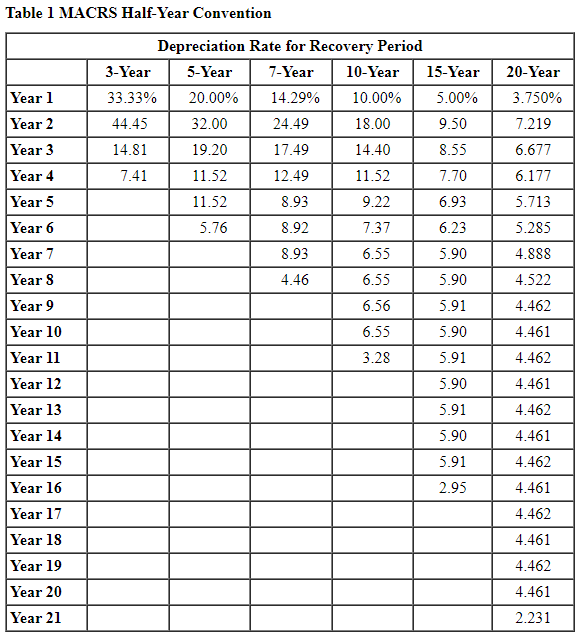
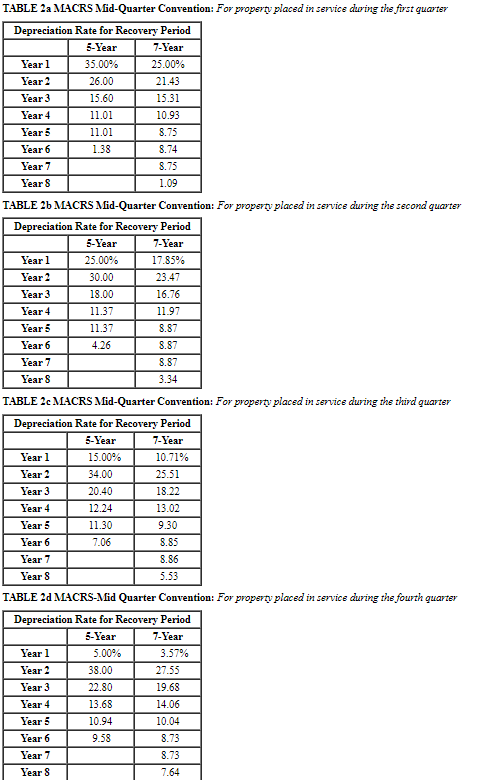
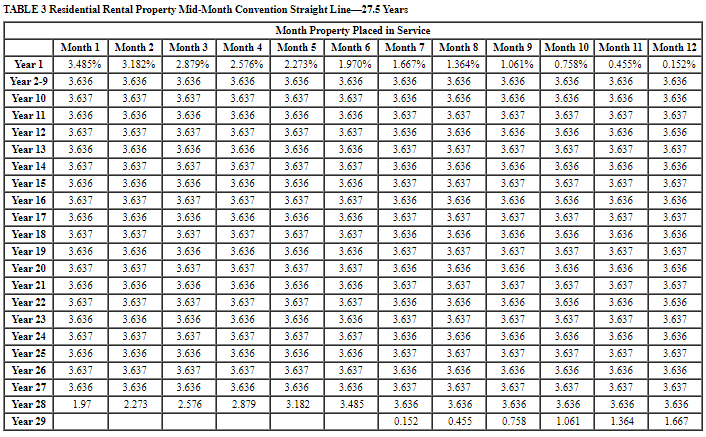
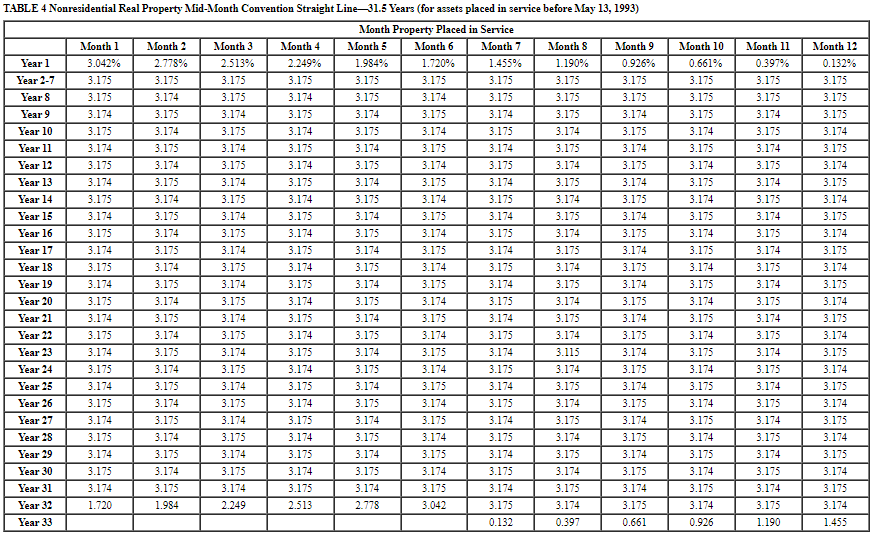
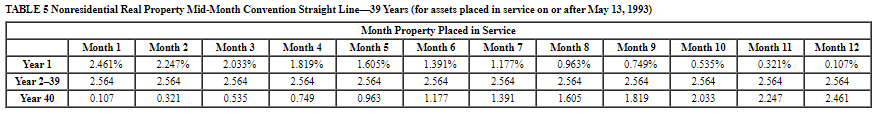
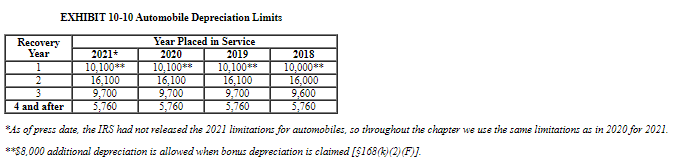
Required: d. Now assume that during 2021, Karane decides to buy a competitor's assets for a purchase price of $1,625,540. Compute the maximum 2021 cost recovery, including 5179 expense and bonus depreciation. Karane purchased the following assets for the lump- sum purchase price: (Round your final answers to the nearest whole dollar amount.) Asset Inventory Office furniture Machinery Patent Goodwill Building Land Cost $ 266,000 276,000 296,000 239,400 6,140 476,000 66,000 Date Placed in Service 09/15/2021 09/15/2021 09/15/2021 09/15/2021 09/15/2021 09/15/2021 09/15/2021 Assume that karane takes the maximum section 179 expense for the Assembly Equipment. Description Cost Section 179 Expense Bonus MACRS Basis Current MACRS Depreciation Current Amortization Total Cost Recovery Deduction S or s 0 s 380,000 $ 1,606,000 86,000 0 $ 0 0 380,000 $ 566,000 86,000 93,062 138,613 27,520 0 93,062 138,613 27,520 0 0 0 0 0 0 0 2020 Assets Office Furniture Machinery Used Delivery Truck 2021 Assets Computers and Information System Luxury Auto Assembly Equipment Storage Building Inventory Office Furniture Machinery Patent Goodwill Building Land 10,100 0 2,889 0 0 446,000 18,100 1,430,000 2,889 0 276,000 296,000 0 0 446,000 0 446,000 0 91,500 0 8,000 83,500 1,430,000 1,050,000 380,000 0 900,000 0 0 900,000 266,000 0 0 0 276,000 0 276,000 0 296,000 0 296,000 0 239,400 0 0 0 6,140 0 0 0 476,000 0 0 476,000 66,000 0 0 0 $ 6,565,040 5 1,050,000 $1,406,000 5 2,491,500 $ 0 0 0 0 0 0 0 3,565 0 3,565 0 0 0 Totals 275,749 S 0ls 2,731,749 Table 1 MACRS Half-Year Convention Year 1 Year 2 Year 3 Year 4 Year 5 Year 6 Year 7 Year 8 Year 9 Year 10 Year 11 Year 12 Year 13 Year 14 Year 15 Year 16 Year 17 Year 18 Year 19 Year 20 Year 21 Depreciation Rate for Recovery Period 3-Year 5-Year 7-Year 10-Year 15-Year 33.33% 20.00% 14.29% 10.00% 5.00% 44.45 32.00 24.49 18.00 9.50 14.81 19.20 17.49 14.40 8.55 7.41 11.52 12.49 11.52 7.70 11.52 8.93 9.22 6.93 5.76 8.92 7.37 6.23 8.93 6.55 5.90 4.46 6.55 5.90 6.56 5.91 6.55 5.90 3.28 5.91 5.90 5.91 5.90 5.91 2.95 20-Year 3.750% 7.219 6.677 6.177 5.713 5.285 4.888 4.522 4.462 4.461 4.462 4.461 4.462 4.461 4.462 4.461 4.462 4.461 4.462 4.461 2.231 TABLE 2a MACRS Mid-Quarter Convention: For property placed in service during the first quarter Depreciation Rate for Recovery Period 5-Year 7-Year Year 1 35.00% 25.00% Year 2 26.00 21.43 Year 3 15.60 15.31 Year 4 11.01 10.93 Year 5 11.01 8.75 Year 6 1.38 8.74 Year 7 8.75 Years 1.09 TABLE 26 MACRS Mid-Quarter Convention: For property placed in service during the second quarter Depreciation Rate for Recovery Period 5-Year 7-Year Year 1 25.00% 17.85% Year 2 30.00 23.47 Year 3 18.00 16.76 Year 4 11.37 11 97 Year 5 11.37 8.87 Year 6 4.26 8.87 Year 7 8.87 Years 3.34 TABLE 26 MACRS Mid-Quarter Convention: For property placed in service during the third quarter Depreciation Rate for Recovery Period 5-Year 7-Year Year 1 15.00% 10.71% Year 2 34.00 25.51 Year 3 20.40 18.22 Year 4 12.24 13.02 Year 5 11.30 9.30 Year 6 7.06 8.85 Year 7 8.86 Year 8 5.53 TABLE 20 MACRS-Mid Quarter Convention: For property placed in service during the fourth quarter Depreciation Rate for Recovery Period 5-Year 7-Year Year 1 5.00% 3.57% Year 2 38.00 27.55 Year 3 22.80 19.68 Year 4 13.68 14.06 Year 5 10.94 10.04 Year 6 9.58 8.73 Year 7 8.73 Year 8 7.64 TABLE 3 Residential Rental Property Mid-Month Convention Straight Line-27.5 Years Month 1 Month 2 Month 3 Month Property Placed in Service Month 5 Month 6 Month 7 2.273% 1.970% 1.667% Month 4 2.576% Month 8 Month 9 Month 10 Month 11 Month 12 Year 1 3.485% 3.182% 2.879% 1.364% 1.061% 0.758% 0.455% 0.152% Year 2-9 3.636 3.636 3.636 3.636 3.636 3.636 3.636 3.636 3.636 3.636 3.636 3.636 Year 10 3.637 3.637 3.637 3.637 3.637 3.637 3.636 3.636 3.636 3.636 3.636 3.636 Year 11 3.636 3.636 3.636 3.636 3.636 3.636 3.637 3.637 3.637 3.637 3.637 3.637 Year 12 3.637 3.637 3.637 3.637 3.637 3.637 3.636 3.636 3.636 3.636 3.636 3.636 Year 13 3.636 3.636 3.636 3.636 3.636 3.636 3.637 3.637 3.637 3.637 3.637 3.637 Year 14 3.637 3.637 3.637 3.637 3.637 3.637 3.636 3.636 3.636 3.636 3.636 3.636 Year 15 3.636 3.636 3.636 3.636 3.636 3.636 3.637 3.637 3.637 3.637 3.637 3.637 Year 16 3.637 3.637 3.637 3.637 3.637 3.637 3.636 3.636 3.636 3.636 3.636 3.636 Year 17 3.636 3.636 3.636 3.636 3.636 3.636 3.637 3.637 3.637 3.637 3.637 3.637 Year 18 3.637 3.637 3.637 3.637 3.637 3.637 3.636 3.636 3.636 3.636 3.636 3.636 Year 19 3.636 3.636 3.636 3.636 3.636 3.636 3.637 3.637 3.637 3.637 3.637 3.637 Year 20 3.637 3.637 3.637 3.637 3.637 3.637 3.636 3.636 3.636 3.636 3.636 3.636 Year 21 3.636 3.636 3.636 3.636 3.636 3.636 3.637 3.637 3.637 3.637 3.637 3.637 Year 22 3.637 3.637 3.637 3.637 3.637 3.637 3.636 3.636 3.636 3.636 3.636 3.636 Year 23 3.636 3.636 3.636 3.636 3.636 3.636 3.637 3.637 3.637 3.637 3.637 3.637 Year 24 3.637 3.637 3.637 3.637 3.637 3.637 3.636 3.636 3.636 3.636 3.636 3.636 Year 25 3.636 3.636 3.636 3.636 3.636 3.636 3.637 3.637 3.637 3.637 3.637 3.637 Year 26 3.637 3.637 3.637 3.637 3.637 3.637 3.636 3.636 3.636 3.636 3.636 3.636 Year 27 3.636 3.636 3.636 3.636 3.636 3.636 3.637 3.637 3.637 3.637 3.637 3.637 Year 28 1.97 2.273 2.576 2.879 3.182 3.485 3.636 3.636 3.636 3.636 3.636 3.636 Year 29 0.152 0.455 0.758 1.061 1.364 1.667 TABLE 4 Nonresidential Real Property Mid-Month Convention Straight Line-31.5 Years (for assets placed in service before May 13, 1993) Month Property Placed in Service Month 4 Month 5 Month 6 Month 7 Month 8 Month 9 Month 1 3.042% Month 2 2.778% Month 3 2.513% Year 1 2.249% 1.984% 1.720% 1.455% 1.190% 0.926% Year 2-7 3.175 3.175 3.175 3.175 3.175 3.175 3.175 3.175 3.175 Year 8 3.175 3.174 3.175 3.174 3.175 3.174 3.175 3.175 3.175 Year 9 3.174 3.175 3.174 3.175 3.174 3.175 3.174 3.175 3.174 Year 10 3.175 3.174 3.175 3.174 3.175 3.174 3.175 3.174 3.175 Year 11 3.174 3.175 3.174 3.175 3.174 3.175 3.174 3.175 3.174 Year 12 3.175 3.174 3.175 3.174 3.175 3.174 3.175 3.174 3.175 Year 13 3.174 3.175 3.174 3.175 3.174 3.175 3.174 3.175 3.174 Year 14 3.175 3.174 3.175 3.174 3.175 3.174 3.175 3.174 3.175 Year 15 3.174 3.175 3.174 3.175 3.174 3.175 3.174 3.175 3.174 Year 16 3.175 3.174 3.175 3.174 3.175 3.174 3.175 3.174 3.175 Year 17 3.174 3.175 3.174 3.175 3.174 3.175 3.174 3.175 3.174 Year 18 3.175 3.174 3.175 3.174 3.175 3.174 3.175 3.174 3.175 Year 19 3.174 3.175 3.174 3.175 3.174 3.175 3.174 3.175 3.174 Year 20 3.175 3.174 3.175 3.174 3.175 3.174 3.175 3.174 3.175 Year 21 3.174 3.175 3.174 3.175 3.174 3.175 3.174 3.175 3.174 Year 22 3.175 3.174 3.175 3.174 3.175 3.174 3.175 3.174 3.175 Year 23 3.174 3.175 3.174 3.175 3.174 3.175 3.174 3.115 3.174 Year 24 3.175 3.174 3.175 3.174 3.175 3.174 3.175 3.174 3.175 Year 25 3.174 3.175 3.174 3.175 3.174 3.175 3.174 3.175 3.174 Year 26 3.175 3.174 3.175 3.174 3.175 3.174 3.175 3.174 3.175 Year 27 3.174 3.175 3.174 3.175 3.174 3.175 3.174 3.175 3.174 Year 28 3.175 3.175 3.174 3.174 3.175 3.174 8.175 Year 29 3.174 3.175 3.174 3.175 3.174 3.175 3.174 3.175 3.174 Year 30 3.175 3.174 3.175 3.174 3.175 3.174 3.175 3.174 3.175 Year 31 3.174 3.175 3.174 3.175 3.174 3.175 3.174 3.175 3.174 Year 32 1.720 1.984 2.249 2.513 2.778 3.042 3.175 3.174 3.175 Year 33 0.132 0.397 0.661 Month 10 0.661% 3.175 3.175 3.175 3.174 3.175 3.174 3.175 3.174 3.175 3.174 3.175 3.174 3.175 3.174 3.175 3.174 3.175 3.174 3.175 3.174 3.175 3.174 3.175 3.174 3.175 3.174 0.926 Month 11 0.397% 3.175 3.175 3.174 3.175 3.174 3.175 3.174 3.175 3.174 3.175 3.174 3.175 3.174 3.175 3.174 3.175 3.174 3.175 3.174 3.175 3.174 3.175 3.174 3.175 3.174 3.175 1.190 Month 12 0.132% 3.175 3.175 3.175 3.174 3.175 3.174 3.175 3.174 3.175 3.174 3.175 3.174 3.175 3.174 3.175 3.174 3.175 3.174 3.175 3.174 3.175 3.174 3.175 3.174 3.175 3.174 1.455 TABLE 5 Nonresidential Real Property Mid-Month Convention Straight Line39 Years (for assets placed in service on or after May 13, 1993) Month Property Placed in Service Month 1 Month 2 Month 3 Month 4 Month 5 Month 6 Month 7 Month 8 Month 9 Year 1 2.461% 2.247% 2.033% 1.819% 1.605% 1.391% 1.177% 0.963% 0.749% Year 2-39 2.564 2.564 2.564 2.564 2.564 2.564 2.564 2.564 2.564 Year 40 0.107 0.321 0.535 0.749 0.963 1.177 1.391 1.605 1.819 Month 10 0.535% 2.564 2.033 Month 11 0.321% 2.564 2.247 Month 12 0.107% 2.564 2.461 EXHIBIT 10-10 Automobile Depreciation Limits Year Placed in Service Recovery Year 2021* 2020 2019 2018 1 10,100** 10,100** 10,100** 10,000** 2 16,100 16,100 16,100 16,000 9,700 9,700 9,700 9,600 4 and after 5,760 5,760 5,760 5,760 *As of press date, the IRS had not released the 2021 limitations for automobiles, so throughout the chapter we use the same limitations as in 2020 for 2021. **$8,000 additional depreciation is allowed when bonus depreciation is claimed [168(k) (2) (F)]- Required: d. Now assume that during 2021, Karane decides to buy a competitor's assets for a purchase price of $1,625,540. Compute the maximum 2021 cost recovery, including 5179 expense and bonus depreciation. Karane purchased the following assets for the lump- sum purchase price: (Round your final answers to the nearest whole dollar amount.) Asset Inventory Office furniture Machinery Patent Goodwill Building Land Cost $ 266,000 276,000 296,000 239,400 6,140 476,000 66,000 Date Placed in Service 09/15/2021 09/15/2021 09/15/2021 09/15/2021 09/15/2021 09/15/2021 09/15/2021 Assume that karane takes the maximum section 179 expense for the Assembly Equipment. Description Cost Section 179 Expense Bonus MACRS Basis Current MACRS Depreciation Current Amortization Total Cost Recovery Deduction S or s 0 s 380,000 $ 1,606,000 86,000 0 $ 0 0 380,000 $ 566,000 86,000 93,062 138,613 27,520 0 93,062 138,613 27,520 0 0 0 0 0 0 0 2020 Assets Office Furniture Machinery Used Delivery Truck 2021 Assets Computers and Information System Luxury Auto Assembly Equipment Storage Building Inventory Office Furniture Machinery Patent Goodwill Building Land 10,100 0 2,889 0 0 446,000 18,100 1,430,000 2,889 0 276,000 296,000 0 0 446,000 0 446,000 0 91,500 0 8,000 83,500 1,430,000 1,050,000 380,000 0 900,000 0 0 900,000 266,000 0 0 0 276,000 0 276,000 0 296,000 0 296,000 0 239,400 0 0 0 6,140 0 0 0 476,000 0 0 476,000 66,000 0 0 0 $ 6,565,040 5 1,050,000 $1,406,000 5 2,491,500 $ 0 0 0 0 0 0 0 3,565 0 3,565 0 0 0 Totals 275,749 S 0ls 2,731,749 Table 1 MACRS Half-Year Convention Year 1 Year 2 Year 3 Year 4 Year 5 Year 6 Year 7 Year 8 Year 9 Year 10 Year 11 Year 12 Year 13 Year 14 Year 15 Year 16 Year 17 Year 18 Year 19 Year 20 Year 21 Depreciation Rate for Recovery Period 3-Year 5-Year 7-Year 10-Year 15-Year 33.33% 20.00% 14.29% 10.00% 5.00% 44.45 32.00 24.49 18.00 9.50 14.81 19.20 17.49 14.40 8.55 7.41 11.52 12.49 11.52 7.70 11.52 8.93 9.22 6.93 5.76 8.92 7.37 6.23 8.93 6.55 5.90 4.46 6.55 5.90 6.56 5.91 6.55 5.90 3.28 5.91 5.90 5.91 5.90 5.91 2.95 20-Year 3.750% 7.219 6.677 6.177 5.713 5.285 4.888 4.522 4.462 4.461 4.462 4.461 4.462 4.461 4.462 4.461 4.462 4.461 4.462 4.461 2.231 TABLE 2a MACRS Mid-Quarter Convention: For property placed in service during the first quarter Depreciation Rate for Recovery Period 5-Year 7-Year Year 1 35.00% 25.00% Year 2 26.00 21.43 Year 3 15.60 15.31 Year 4 11.01 10.93 Year 5 11.01 8.75 Year 6 1.38 8.74 Year 7 8.75 Years 1.09 TABLE 26 MACRS Mid-Quarter Convention: For property placed in service during the second quarter Depreciation Rate for Recovery Period 5-Year 7-Year Year 1 25.00% 17.85% Year 2 30.00 23.47 Year 3 18.00 16.76 Year 4 11.37 11 97 Year 5 11.37 8.87 Year 6 4.26 8.87 Year 7 8.87 Years 3.34 TABLE 26 MACRS Mid-Quarter Convention: For property placed in service during the third quarter Depreciation Rate for Recovery Period 5-Year 7-Year Year 1 15.00% 10.71% Year 2 34.00 25.51 Year 3 20.40 18.22 Year 4 12.24 13.02 Year 5 11.30 9.30 Year 6 7.06 8.85 Year 7 8.86 Year 8 5.53 TABLE 20 MACRS-Mid Quarter Convention: For property placed in service during the fourth quarter Depreciation Rate for Recovery Period 5-Year 7-Year Year 1 5.00% 3.57% Year 2 38.00 27.55 Year 3 22.80 19.68 Year 4 13.68 14.06 Year 5 10.94 10.04 Year 6 9.58 8.73 Year 7 8.73 Year 8 7.64 TABLE 3 Residential Rental Property Mid-Month Convention Straight Line-27.5 Years Month 1 Month 2 Month 3 Month Property Placed in Service Month 5 Month 6 Month 7 2.273% 1.970% 1.667% Month 4 2.576% Month 8 Month 9 Month 10 Month 11 Month 12 Year 1 3.485% 3.182% 2.879% 1.364% 1.061% 0.758% 0.455% 0.152% Year 2-9 3.636 3.636 3.636 3.636 3.636 3.636 3.636 3.636 3.636 3.636 3.636 3.636 Year 10 3.637 3.637 3.637 3.637 3.637 3.637 3.636 3.636 3.636 3.636 3.636 3.636 Year 11 3.636 3.636 3.636 3.636 3.636 3.636 3.637 3.637 3.637 3.637 3.637 3.637 Year 12 3.637 3.637 3.637 3.637 3.637 3.637 3.636 3.636 3.636 3.636 3.636 3.636 Year 13 3.636 3.636 3.636 3.636 3.636 3.636 3.637 3.637 3.637 3.637 3.637 3.637 Year 14 3.637 3.637 3.637 3.637 3.637 3.637 3.636 3.636 3.636 3.636 3.636 3.636 Year 15 3.636 3.636 3.636 3.636 3.636 3.636 3.637 3.637 3.637 3.637 3.637 3.637 Year 16 3.637 3.637 3.637 3.637 3.637 3.637 3.636 3.636 3.636 3.636 3.636 3.636 Year 17 3.636 3.636 3.636 3.636 3.636 3.636 3.637 3.637 3.637 3.637 3.637 3.637 Year 18 3.637 3.637 3.637 3.637 3.637 3.637 3.636 3.636 3.636 3.636 3.636 3.636 Year 19 3.636 3.636 3.636 3.636 3.636 3.636 3.637 3.637 3.637 3.637 3.637 3.637 Year 20 3.637 3.637 3.637 3.637 3.637 3.637 3.636 3.636 3.636 3.636 3.636 3.636 Year 21 3.636 3.636 3.636 3.636 3.636 3.636 3.637 3.637 3.637 3.637 3.637 3.637 Year 22 3.637 3.637 3.637 3.637 3.637 3.637 3.636 3.636 3.636 3.636 3.636 3.636 Year 23 3.636 3.636 3.636 3.636 3.636 3.636 3.637 3.637 3.637 3.637 3.637 3.637 Year 24 3.637 3.637 3.637 3.637 3.637 3.637 3.636 3.636 3.636 3.636 3.636 3.636 Year 25 3.636 3.636 3.636 3.636 3.636 3.636 3.637 3.637 3.637 3.637 3.637 3.637 Year 26 3.637 3.637 3.637 3.637 3.637 3.637 3.636 3.636 3.636 3.636 3.636 3.636 Year 27 3.636 3.636 3.636 3.636 3.636 3.636 3.637 3.637 3.637 3.637 3.637 3.637 Year 28 1.97 2.273 2.576 2.879 3.182 3.485 3.636 3.636 3.636 3.636 3.636 3.636 Year 29 0.152 0.455 0.758 1.061 1.364 1.667 TABLE 4 Nonresidential Real Property Mid-Month Convention Straight Line-31.5 Years (for assets placed in service before May 13, 1993) Month Property Placed in Service Month 4 Month 5 Month 6 Month 7 Month 8 Month 9 Month 1 3.042% Month 2 2.778% Month 3 2.513% Year 1 2.249% 1.984% 1.720% 1.455% 1.190% 0.926% Year 2-7 3.175 3.175 3.175 3.175 3.175 3.175 3.175 3.175 3.175 Year 8 3.175 3.174 3.175 3.174 3.175 3.174 3.175 3.175 3.175 Year 9 3.174 3.175 3.174 3.175 3.174 3.175 3.174 3.175 3.174 Year 10 3.175 3.174 3.175 3.174 3.175 3.174 3.175 3.174 3.175 Year 11 3.174 3.175 3.174 3.175 3.174 3.175 3.174 3.175 3.174 Year 12 3.175 3.174 3.175 3.174 3.175 3.174 3.175 3.174 3.175 Year 13 3.174 3.175 3.174 3.175 3.174 3.175 3.174 3.175 3.174 Year 14 3.175 3.174 3.175 3.174 3.175 3.174 3.175 3.174 3.175 Year 15 3.174 3.175 3.174 3.175 3.174 3.175 3.174 3.175 3.174 Year 16 3.175 3.174 3.175 3.174 3.175 3.174 3.175 3.174 3.175 Year 17 3.174 3.175 3.174 3.175 3.174 3.175 3.174 3.175 3.174 Year 18 3.175 3.174 3.175 3.174 3.175 3.174 3.175 3.174 3.175 Year 19 3.174 3.175 3.174 3.175 3.174 3.175 3.174 3.175 3.174 Year 20 3.175 3.174 3.175 3.174 3.175 3.174 3.175 3.174 3.175 Year 21 3.174 3.175 3.174 3.175 3.174 3.175 3.174 3.175 3.174 Year 22 3.175 3.174 3.175 3.174 3.175 3.174 3.175 3.174 3.175 Year 23 3.174 3.175 3.174 3.175 3.174 3.175 3.174 3.115 3.174 Year 24 3.175 3.174 3.175 3.174 3.175 3.174 3.175 3.174 3.175 Year 25 3.174 3.175 3.174 3.175 3.174 3.175 3.174 3.175 3.174 Year 26 3.175 3.174 3.175 3.174 3.175 3.174 3.175 3.174 3.175 Year 27 3.174 3.175 3.174 3.175 3.174 3.175 3.174 3.175 3.174 Year 28 3.175 3.175 3.174 3.174 3.175 3.174 8.175 Year 29 3.174 3.175 3.174 3.175 3.174 3.175 3.174 3.175 3.174 Year 30 3.175 3.174 3.175 3.174 3.175 3.174 3.175 3.174 3.175 Year 31 3.174 3.175 3.174 3.175 3.174 3.175 3.174 3.175 3.174 Year 32 1.720 1.984 2.249 2.513 2.778 3.042 3.175 3.174 3.175 Year 33 0.132 0.397 0.661 Month 10 0.661% 3.175 3.175 3.175 3.174 3.175 3.174 3.175 3.174 3.175 3.174 3.175 3.174 3.175 3.174 3.175 3.174 3.175 3.174 3.175 3.174 3.175 3.174 3.175 3.174 3.175 3.174 0.926 Month 11 0.397% 3.175 3.175 3.174 3.175 3.174 3.175 3.174 3.175 3.174 3.175 3.174 3.175 3.174 3.175 3.174 3.175 3.174 3.175 3.174 3.175 3.174 3.175 3.174 3.175 3.174 3.175 1.190 Month 12 0.132% 3.175 3.175 3.175 3.174 3.175 3.174 3.175 3.174 3.175 3.174 3.175 3.174 3.175 3.174 3.175 3.174 3.175 3.174 3.175 3.174 3.175 3.174 3.175 3.174 3.175 3.174 1.455 TABLE 5 Nonresidential Real Property Mid-Month Convention Straight Line39 Years (for assets placed in service on or after May 13, 1993) Month Property Placed in Service Month 1 Month 2 Month 3 Month 4 Month 5 Month 6 Month 7 Month 8 Month 9 Year 1 2.461% 2.247% 2.033% 1.819% 1.605% 1.391% 1.177% 0.963% 0.749% Year 2-39 2.564 2.564 2.564 2.564 2.564 2.564 2.564 2.564 2.564 Year 40 0.107 0.321 0.535 0.749 0.963 1.177 1.391 1.605 1.819 Month 10 0.535% 2.564 2.033 Month 11 0.321% 2.564 2.247 Month 12 0.107% 2.564 2.461 EXHIBIT 10-10 Automobile Depreciation Limits Year Placed in Service Recovery Year 2021* 2020 2019 2018 1 10,100** 10,100** 10,100** 10,000** 2 16,100 16,100 16,100 16,000 9,700 9,700 9,700 9,600 4 and after 5,760 5,760 5,760 5,760 *As of press date, the IRS had not released the 2021 limitations for automobiles, so throughout the chapter we use the same limitations as in 2020 for 2021. **$8,000 additional depreciation is allowed when bonus depreciation is claimed [168(k) (2) (F)]
Step by Step Solution
There are 3 Steps involved in it

Get step-by-step solutions from verified subject matter experts