

Question: I just wanna use the matplotlib to draw a bar chart, and I use the function plotTravel to achieve it, but there are have some
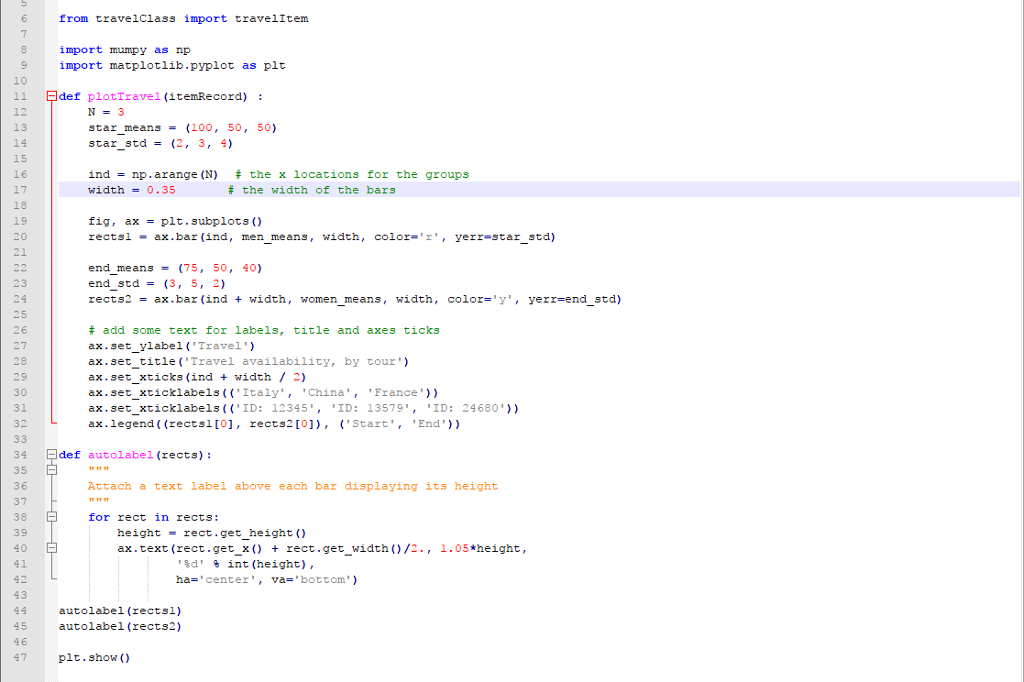
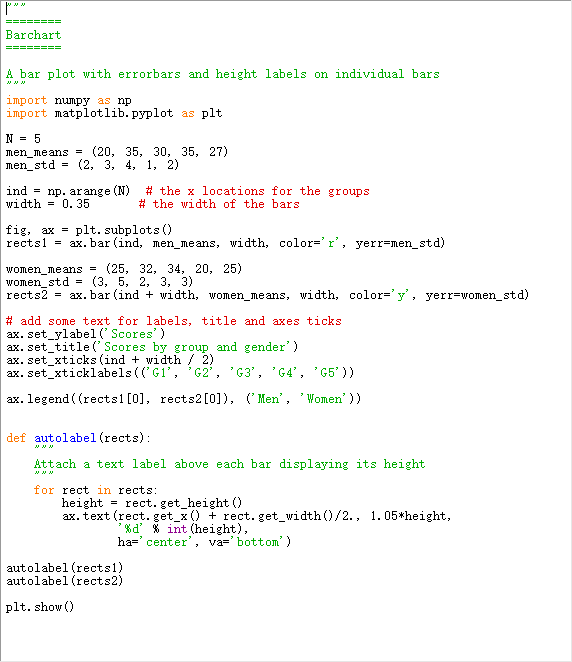
I just wanna use the matplotlib to draw a bar chart, and I use the function plotTravel to achieve it, but there are have some problem about it, who can help me about it, I edit from the offical source from http://matplotlib.org.
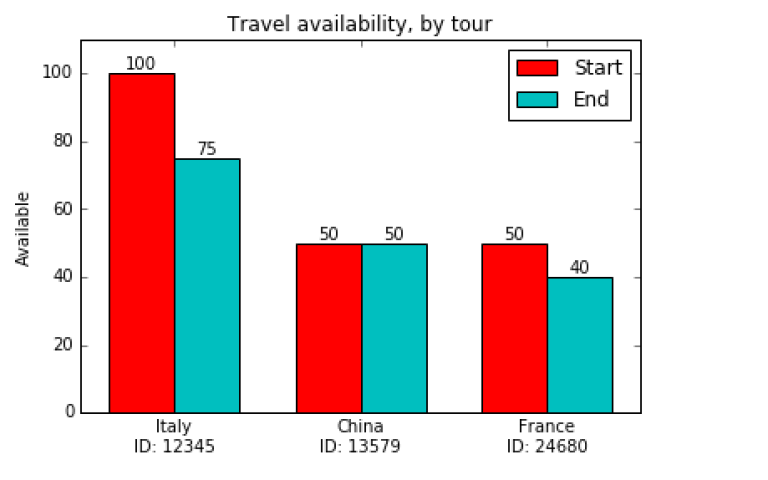
Travel availability, by tour 100 100 Start O End 9 60 50 50 50 20 Italy ID: 12345 China ID: 13579 France ID: 24680
Step by Step Solution
There are 3 Steps involved in it
1 Expert Approved Answer
Step: 1 Unlock

Question Has Been Solved by an Expert!
Get step-by-step solutions from verified subject matter experts
Step: 2 Unlock
Step: 3 Unlock