

Question: I just wanted to know the Guirobi code to solve for this. I asked this question before and I wasn't sure what to do with
I just wanted to know the Guirobi code to solve for this. I asked this question before and I wasn't sure what to do with the population_data and distance_data dictionaries because they didn't match the dataset. Thanks for the help!
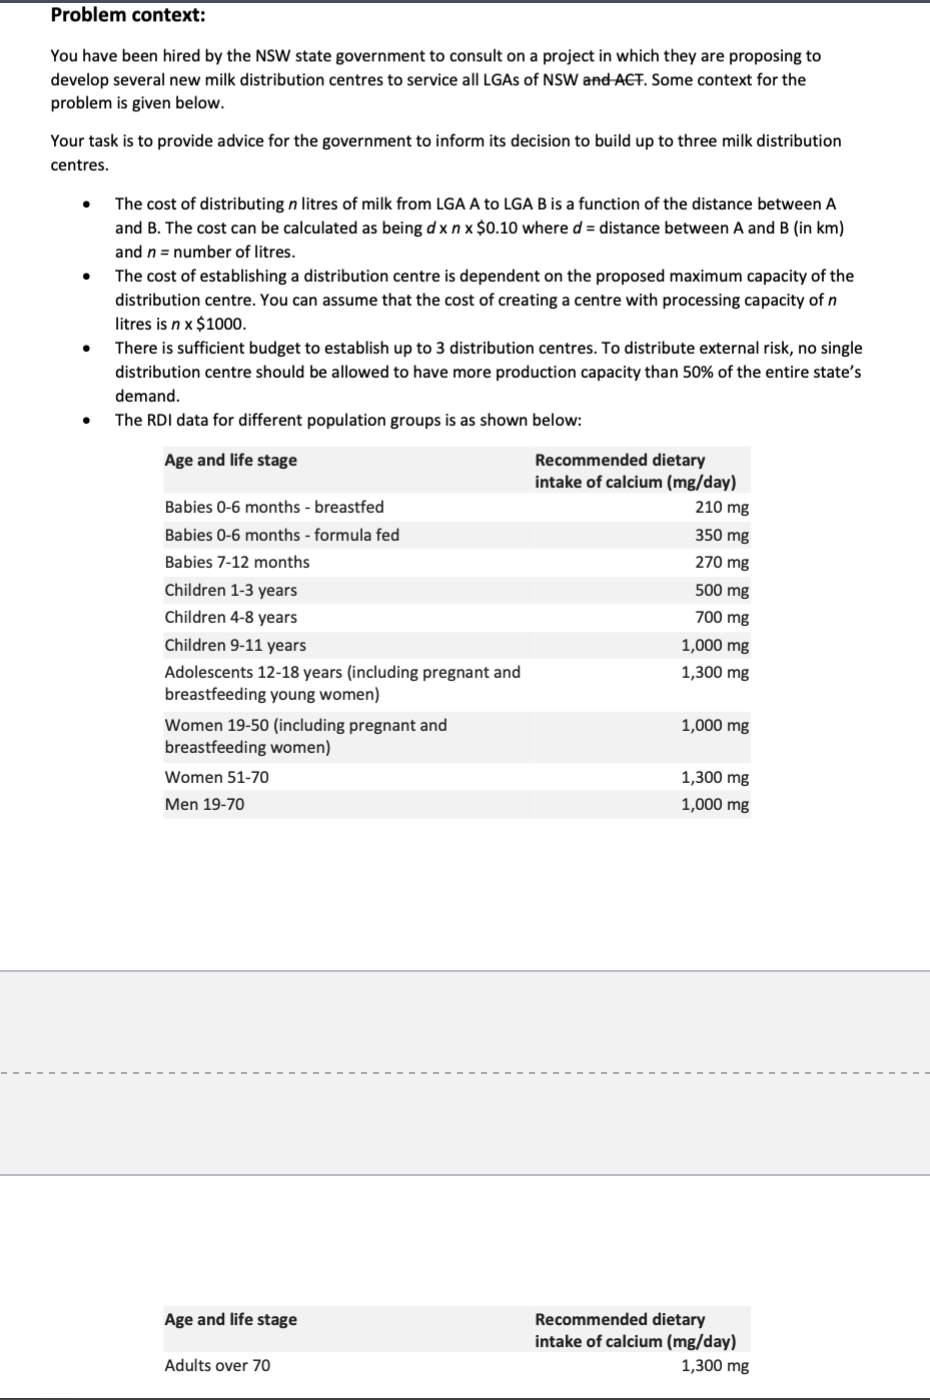
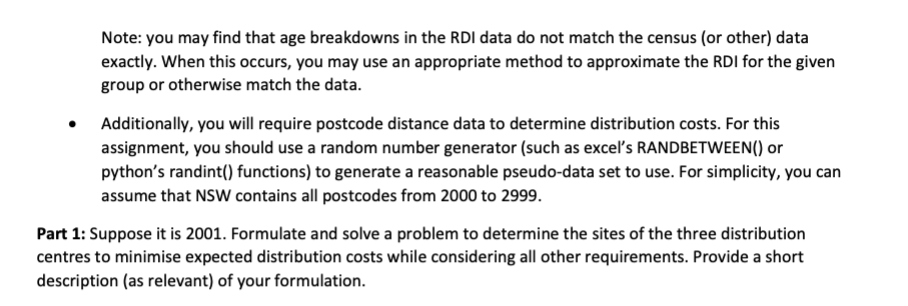
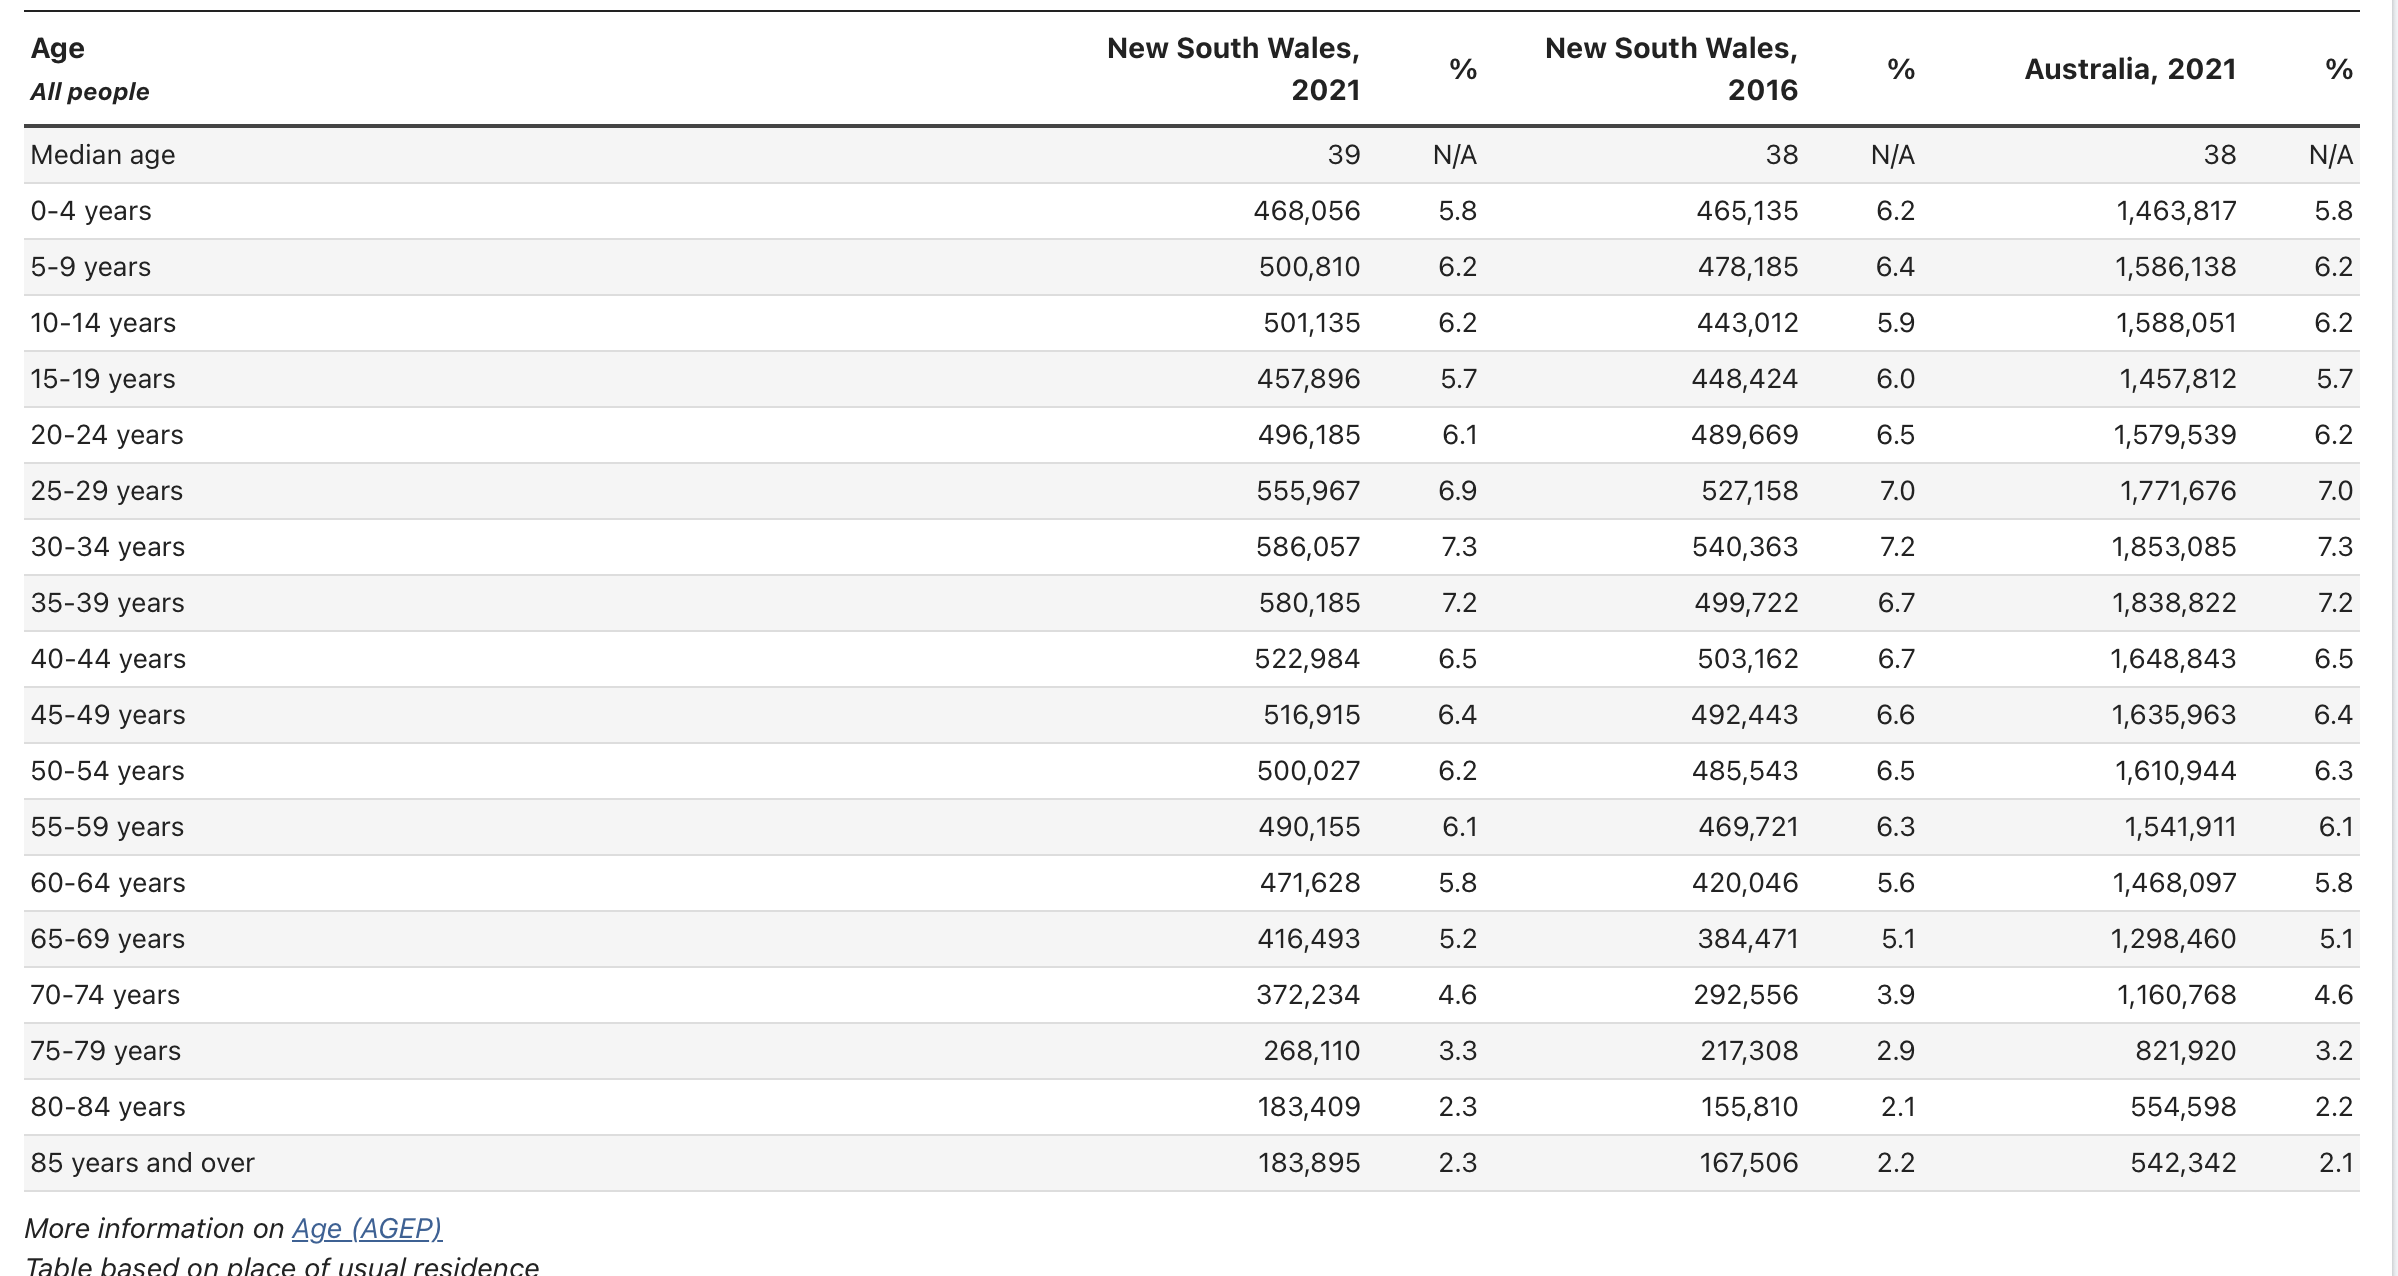
Note: you may find that age breakdowns in the RDI data do not match the census (or other) data exactly. When this occurs, you may use an appropriate method to approximate the RDI for the given group or otherwise match the data. - Additionally, you will require postcode distance data to determine distribution costs. For this assignment, you should use a random number generator (such as excel's RANDBETWEEN() or python's randint() functions) to generate a reasonable pseudo-data set to use. For simplicity, you can assume that NSW contains all postcodes from 2000 to 2999. t 1: Suppose it is 2001. Formulate and solve a problem to determine the sites of the three distribution tres to minimise expected distribution costs while considering all other requirements. Provide a short cription (as relevant) of your formulation. \begin{tabular}{|c|c|c|c|c|c|c|} \hline AgeAllpeople & NewSouthWales,2021 & % & NewSouthWales,2016 & % & Australia, 2021 & % \\ \hline Median age & 39 & N/A & 38 & N/A & 38 & N/A \\ \hline 59 years & 500,810 & 6.2 & 478,185 & 6.4 & 1,586,138 & 6.2 \\ \hline 1014 years & 501,135 & 6.2 & 443,012 & 5.9 & 1,588,051 & 6.2 \\ \hline 1519 years & 457,896 & 5.7 & 448,424 & 6.0 & 1,457,812 & 5.7 \\ \hline 2024 years & 496,185 & 6.1 & 489,669 & 6.5 & 1,579,539 & 6.2 \\ \hline 2529 years & 555,967 & 6.9 & 527,158 & 7.0 & 1,771,676 & 7.0 \\ \hline 3034 years & 586,057 & 7.3 & 540,363 & 7.2 & 1,853,085 & 7.3 \\ \hline 3539 years & 580,185 & 7.2 & 499,722 & 6.7 & 1,838,822 & 7.2 \\ \hline 4044 years & 522,984 & 6.5 & 503,162 & 6.7 & 1,648,843 & 6.5 \\ \hline 4549 years & 516,915 & 6.4 & 492,443 & 6.6 & 1,635,963 & 6.4 \\ \hline 5054 years & 500,027 & 6.2 & 485,543 & 6.5 & 1,610,944 & 6.3 \\ \hline 5559 years & 490,155 & 6.1 & 469,721 & 6.3 & 1,541,911 & 6.1 \\ \hline 6064 years & 471,628 & 5.8 & 420,046 & 5.6 & 1,468,097 & 5.8 \\ \hline 6569 years & 416,493 & 5.2 & 384,471 & 5.1 & 1,298,460 & 5.1 \\ \hline 7074 years & 372,234 & 4.6 & 292,556 & 3.9 & 1,160,768 & 4.6 \\ \hline 7579 years & 268,110 & 3.3 & 217,308 & 2.9 & 821,920 & 3.2 \\ \hline 8084 years & 183,409 & 2.3 & 155,810 & 2.1 & 554,598 & 2.2 \\ \hline 85 years and over & 183,895 & 2.3 & 167,506 & 2.2 & 542,342 & 2.1 \\ \hline \end{tabular} More information on Age (AGEP). Problem context: You have been hired by the NSW state government to consult on a project in which they are proposing to develop several new milk distribution centres to service all LGAs of NSW and ACF. Some context for the problem is given below. Your task is to provide advice for the government to inform its decision to build up to three milk distribution centres. - The cost of distributing n litres of milk from LGA A to LGA B is a function of the distance between A and B. The cost can be calculated as being dn$0.10 where d= distance between A and B (in km ) and n= number of litres. - The cost of establishing a distribution centre is dependent on the proposed maximum capacity of the distribution centre. You can assume that the cost of creating a centre with processing capacity of n litres is n$1000. - There is sufficient budget to establish up to 3 distribution centres. To distribute external risk, no single distribution centre should be allowed to have more production capacity than 50% of the entire state's demand. - The RDI data for different population groups is as shown below
Step by Step Solution
There are 3 Steps involved in it

Get step-by-step solutions from verified subject matter experts