

Question: I know the answer to this question, but I would like to know how the export got the answer. I want to understand how it
I know the answer to this question, but I would like to know how the export got the answer. I want to understand how it is solved.
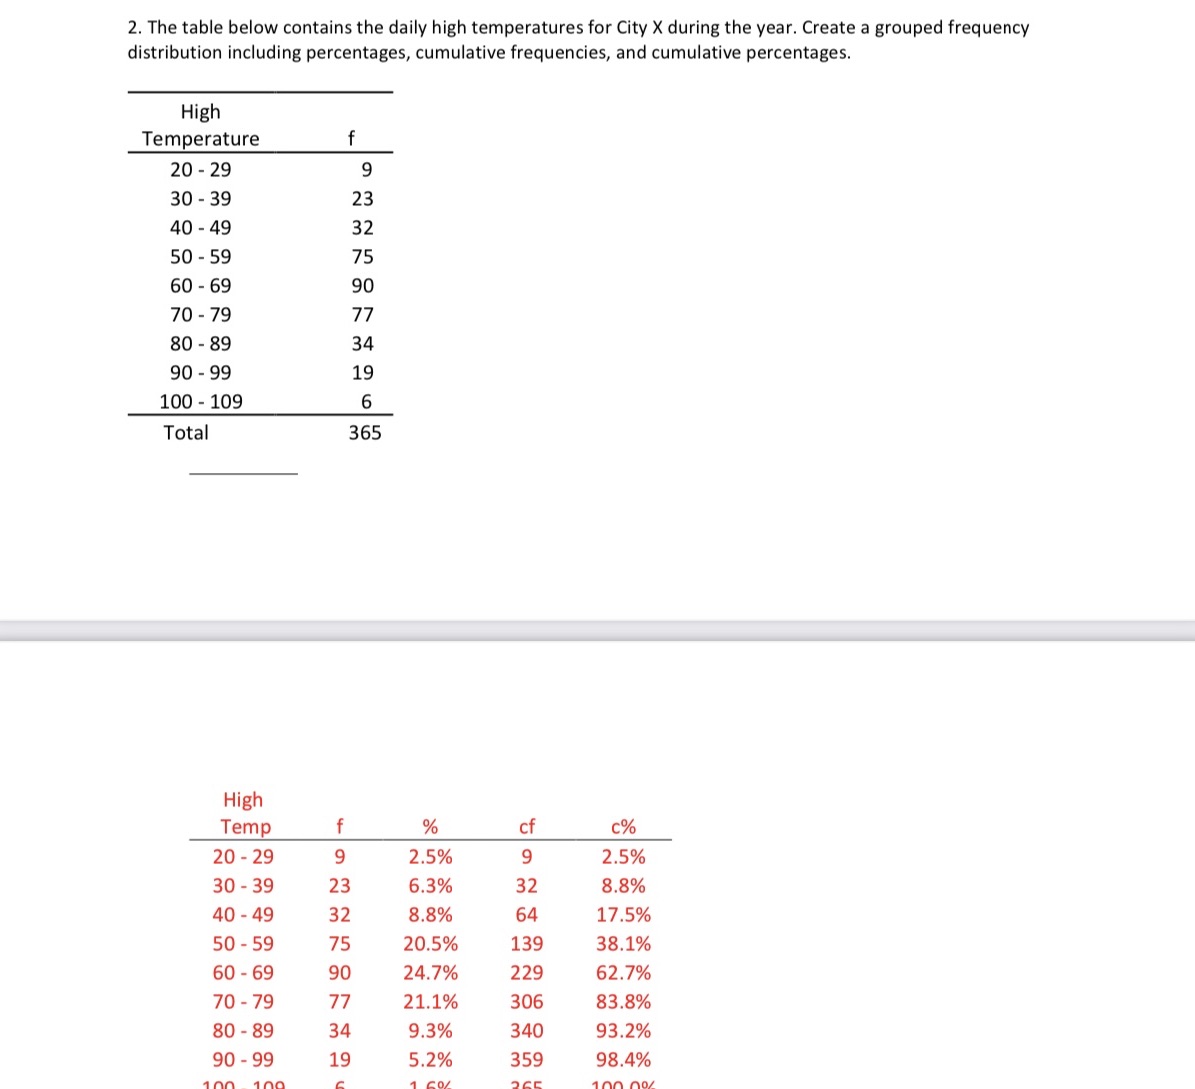
2. The table below contains the daily high temperatures for City X during the year. Create a grouped frequency distribution including percentages, cumulative frequencies, and cumulative percentages. High Temperatu 20 - 29 30 - 39 23 40 - 49 32 50 - 59 75 60 - 69 90 70 - 79 77 80 - 89 34 90 - 99 19 100 - 109 6 Total 365 High Temp f % cf c% 20 - 29 9 2.5% 9 2.5% 30 - 39 23 6.3% 32 8.8% 40 - 49 32 8.8% 64 17.5% 50 - 59 75 20.5% 139 38.1% 60 - 69 90 24.7% 229 62.7% 70 - 79 77 21.1% 306 83.8% 80 - 89 34 9.3% 340 93.2% 90 - 99 19 5.2% 359 98.4%
Step by Step Solution
There are 3 Steps involved in it

Get step-by-step solutions from verified subject matter experts