

Question: I know this is fairly long but I'm really only looking to compare my answer in this problem... don't worry about a worthwhile explanation I
I know this is fairly long but I'm really only looking to compare my answer in this problem... don't worry about a worthwhile explanation I just learn best in comparison with my work and professional work... Thanks!!!
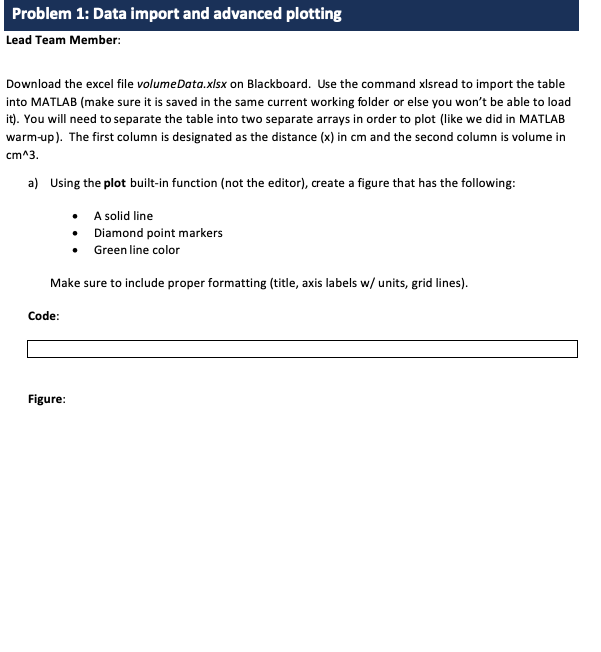
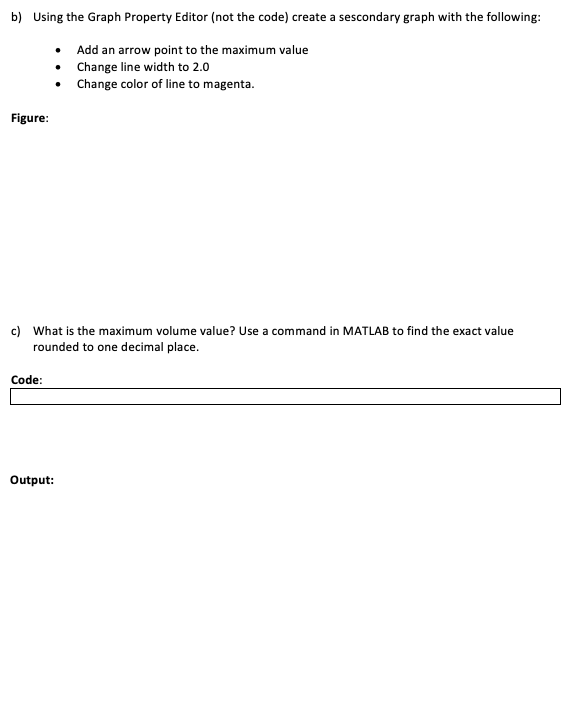

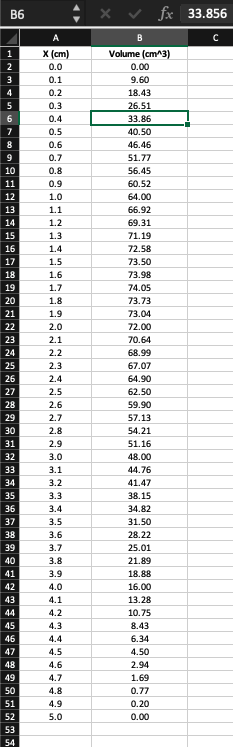
Problem 1: Data import and advanced plotting Lead Team Member: Download the excel file volume Data.xlsx on Blackboard. Use the command xlsread to import the table into MATLAB (make sure it is saved in the same current working folder or else you won't be able to load it). You will need to separate the table into two separate arrays in order to plot (like we did in MATLAB warm-up). The first column is designated as the distance (x) in cm and the second column is volume in cm^3. a) Using the plot built-in function (not the editor), create a figure that has the following: A solid line Diamond point markers Green line color Make sure to include proper formatting (title, axis labels w/ units, grid lines). Code: Figure: b) Using the Graph Property Editor (not the code) create a sescondary graph with the following: Add an arrow point to the maximum value Change line width to 2.0 Change color of line to magenta. Figure: c) What is the maximum volume value? Use a command in MATLAB to find the exact value rounded to one decimal place. Code: Output: b) Using the Graph Property Editor (not the code) create a sescondary graph with the following: Add an arrow point to the maximum value Change line width to 2.0 Change color of line to magenta. Figure: c) What is the maximum volume value? Use a command in MATLAB to find the exact value rounded to one decimal place. Code: Output: X fx 33.856 X (cm) 0.0 0.1 0.2 03 7 9 10 0.4 0.5 0.6 0.7 0.8 0.9 1.0 1.1 1.2 11 12 13 1.3 1.4 1.5 1.6 1.7 1.8 1.9 2.0 2.1 2.2 2.3 2.4 2.5 2.6 2.7 Volume (cm^3) 0.00 9.60 18.43 26.51 33.86 40.50 46.46 51.77 56.45 60.52 64.00 66.92 69.31 71.19 72.58 73.50 73.98 74.05 73.73 73.04 72.00 70.64 68.99 67.07 64.90 62.50 59.90 57.13 54.21 51.16 48.00 44.76 41.47 38.15 34.82 31.50 28.22 25.01 21.89 18.88 16.00 13.28 10.75 8.43 6.34 4.50 2.94 1.69 0.77 0.20 0.00 2.8 2.9 3.0 3.1 3.3 3.6 3.9 42 43 4.0 4.1 4.2 43 46 48 4.4 4.5 4.6 4.7 4.8 4.9 5.0 Problem 1: Data import and advanced plotting Lead Team Member: Download the excel file volume Data.xlsx on Blackboard. Use the command xlsread to import the table into MATLAB (make sure it is saved in the same current working folder or else you won't be able to load it). You will need to separate the table into two separate arrays in order to plot (like we did in MATLAB warm-up). The first column is designated as the distance (x) in cm and the second column is volume in cm^3. a) Using the plot built-in function (not the editor), create a figure that has the following: A solid line Diamond point markers Green line color Make sure to include proper formatting (title, axis labels w/ units, grid lines). Code: Figure: b) Using the Graph Property Editor (not the code) create a sescondary graph with the following: Add an arrow point to the maximum value Change line width to 2.0 Change color of line to magenta. Figure: c) What is the maximum volume value? Use a command in MATLAB to find the exact value rounded to one decimal place. Code: Output: b) Using the Graph Property Editor (not the code) create a sescondary graph with the following: Add an arrow point to the maximum value Change line width to 2.0 Change color of line to magenta. Figure: c) What is the maximum volume value? Use a command in MATLAB to find the exact value rounded to one decimal place. Code: Output: X fx 33.856 X (cm) 0.0 0.1 0.2 03 7 9 10 0.4 0.5 0.6 0.7 0.8 0.9 1.0 1.1 1.2 11 12 13 1.3 1.4 1.5 1.6 1.7 1.8 1.9 2.0 2.1 2.2 2.3 2.4 2.5 2.6 2.7 Volume (cm^3) 0.00 9.60 18.43 26.51 33.86 40.50 46.46 51.77 56.45 60.52 64.00 66.92 69.31 71.19 72.58 73.50 73.98 74.05 73.73 73.04 72.00 70.64 68.99 67.07 64.90 62.50 59.90 57.13 54.21 51.16 48.00 44.76 41.47 38.15 34.82 31.50 28.22 25.01 21.89 18.88 16.00 13.28 10.75 8.43 6.34 4.50 2.94 1.69 0.77 0.20 0.00 2.8 2.9 3.0 3.1 3.3 3.6 3.9 42 43 4.0 4.1 4.2 43 46 48 4.4 4.5 4.6 4.7 4.8 4.9 5.0
Step by Step Solution
There are 3 Steps involved in it

Get step-by-step solutions from verified subject matter experts