

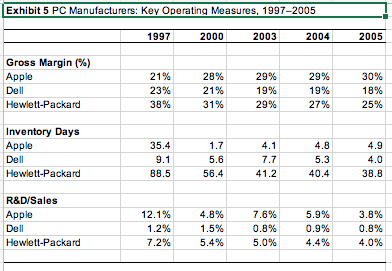
Question: I mainly need help with financial analysis, like the EBITDA, Profitability ratio, Liquidity Ratio, Leverage Ratio, Activities Ratio and an understanding if the firm itself
I mainly need help with financial analysis, like the EBITDA, Profitability ratio, Liquidity Ratio, Leverage Ratio, Activities Ratio and an understanding if the firm itself financially healthy?
| Exhibit 8 Apple Competitors: Selected Financial Information, 20002005 (in millions of dollars) | ||||||
| 2000 | 2001 | 2002 | 2003 | 2004 | 2005 | |
| Dell | ||||||
| Total revenues | 31,888 | 31,168 | 35,404 | 41,444 | 49,205 | 55,908 |
| Cost of sales | 25,205 | 25,422 | 28,844 | 33,629 | 39,856 | 45,620 |
| R&D | 482 | 321 | 319 | 330 | 463 | 463 |
| SG&A | 3,675 | 3,236 | 3,505 | 4,008 | 4,761 | 5,140 |
| Net income | 2,177 | 1,246 | 2,122 | 2,645 | 3,043 | 3,572 |
| Total assets | 13,435 | 13,535 | 15,470 | 19,311 | 23,215 | 23,09 |
| Total current liabilities | 6,543 | 7,519 | 8,933 | 10,896 | 14,136 | 15,927 |
| Total stockholders' equity | 5,622 | 4,694 | 4,873 | 6,280 | 6,485 | 4,129 |
| Gross margin | 21% | 18% | 19% | 19% | 19% | 18% |
| R&D/sales | 2% | 1% | 1% | 1% | 1% | 1% |
| SG&A/sales | 12% | 10% | 10% | 10% | 10% | 9% |
| Return on sales | 7% | 4% | 6% | 6% | 6% | 6% |
| Market value at year-end | 45,630 | 70,858 | 68,968 | 87,003 | 104,689 | 70,488 |
| Hewlett-Packard | ||||||
| Total revenues | 48,782 | 45,226 | 56,588 | 73,061 | 79,905 | 86,696 |
| Cost of sales | 33,709 | 32,279 | 40,134 | 51,857 | 58,540 | 64,718 |
| R&D | 2,646 | 2,670 | 4,105 | 3,653 | 3,543 | 3,492 |
| SG&A | 10,029 | 9,722 | 12,345 | 14,664 | 14,530 | 14,674 |
| Net income | 3,697 | 408 | (903) | 2,539 | 3,497 | 2,398 |
| Total assets | 34,009 | 32,584 | 70,710 | 74,708 | 76,138 | 77,317 |
| Total current liabilities | 15,197 | 13,964 | 24,310 | 26,630 | 28,588 | 31,460 |
| Total stockholders' equity | 14,209 | 13,953 | 36,262 | 37,746 | 37,564 | 37,176 |
| Gross margin | 31% | 29% | 29% | 29% | 27% | 25% |
| R&D/sales | 5% | 6% | 7% | 5% | 4% | 4% |
| SG&A/sales | 21% | 21% | 22% | 20% | 18% | 17% |
| Return on sales | 8% | 1% | -2% | 3% | 4% | 3% |
| Market value at year-end | 62,431 | 39,848 | 52,973 | 70,039 | 63,327 | 81,242 |
| Lenovo | ||||||
| Total revenues | 234.1 | 200.4 | 208.6 | 191.7 | 164.7 | 2,891.5 |
| Cost of sales | 104.4 | 84.0 | 85.4 | 83.7 | 74.3 | 2,741.1 |
| R&D | NA | NA | NA | NA | NA | NA |
| SG&A | 74.2 | 68.6 | 76.8 | 66.6 | 53.9 | 37.7 |
| Net income | 20.8 | 16.0 | (61.8) | 16.4 | 23.8 | 143.6 |
| Total assets | 277.8 | 279.8 | 181.3 | 142.3 | 167.4 | 1,157.9 |
| Total current liabilities | 24.5 | 31.3 | 27.0 | 20.2 | 15.3 | 445.2 |
| Total stockholders' equity | 140.6 | 156.7 | 96.7 | 114.3 | 143.8 | 667.2 |
| Gross margin | 55.4% | 58.1% | 59.1% | 56.3% | 54.9% | 5.2% |
| R&D/sales | NA | NA | NA | NA | NA | NA |
| SG&A/sales | 31.7% | 34.2% | 36.8% | 34.8% | 32.7% | 1.3% |
| Return on sales | 8.9% | 8.0% | -29.6% | 8.6% | 14.4% | 5.0% |
| Market value at year-end | 4,696 | 3,833 | 2,501 | 3,200 | 2,236 | 3,923 |
| Intel | ||||||
| Total revenues | 33,726 | 26,539 | 26,764 | 30,141 | 34,209 | 38,826 |
| Cost of sales | 9,429 | 9,649 | 8,389 | 8,253 | 9,591 | 15,777 |
| R&D | 4,006 | 3,994 | 4,054 | 4,365 | 4,778 | 5,145 |
| SG&A | 8,986 | 8,260 | 8,543 | 8,736 | 9,466 | 5,688 |
| Net income | 10,535 | 1,291 | 3,117 | 5,641 | 7,516 | 8,664 |
| Total assets | 47,945 | 44,395 | 44,224 | 47,143 | 48,143 | 48,314 |
| Total current liabilities | 8,650 | 6,570 | 6,595 | 6,879 | 8,006 | 9,234 |
| Total stockholders' equity | 37,322 | 35,830 | 35,468 | 37,846 | 38,579 | 36,182 |
| Gross margin | 72% | 64% | 69% | 73% | 72% | 59% |
| R&D/sales | 12% | 15% | 15% | 14% | 14% | 13% |
| SG&A/sales | 27% | 31% | 32% | 29% | 28% | 15% |
| Return on sales | 31% | 5% | 12% | 19% | 22% | 22% |
| Market value at year-end | 202,321 | 211,092 | 103,836 | 209,351 | 147,895 | 150,484 |
| Microsoft | ||||||
| Total revenues | 22,956 | 25,296 | 28,365 | 32,187 | 36,835 | 39,788 |
| Cost of sales | 2,334 | 1,919 | 4,177 | 4,596 | 5,899 | 5,316 |
| R&D | 3,775 | 4,379 | 4,307 | 4,659 | 7,779 | 6,184 |
| SG&A | 8,925 | 10,121 | 10,604 | 12,278 | 18,560 | 16,946 |
| Net income | 9,421 | 7,346 | 7,829 | 9,993 | 8,168 | 12,254 |
| Total assets | 52,150 | 59,257 | 67,646 | 79,571 | 92,389 | 70,815 |
| Total current liabilities | 9,755 | 11,132 | 12,744 | 13,974 | 14,969 | 16,877 |
| Total stockholders' equity | 41,368 | 47,289 | 52,180 | 61,020 | 74,825 | 48,115 |
| Gross margin | 90% | 92% | 85% | 86% | 84% | 87% |
| R&D/sales | 16% | 17% | 15% | 14% | 21% | 16% |
| SG&A/sales | 39% | 40% | 37% | 38% | 50% | 43% |
| Return on sales | 41% | 29% | 28% | 31% | 22% | 31% |
| Market value at year-end | 231,290 | 356,806 | 276,412 | 296,073 | 290,720 | 278,358 |
This semester the written case will be Apple Inc. in 2006. A complete case analysis contains three main parts:
A short financial analysis to assess the companys health
A complete analysis of the firm (internal and external)
A recommended strategy based on the results
The financial analysis should demonstrate two things:
1. Is the firm itself financially healthy? Look at its performance over time, both in terms of being profitable or solvent, and how the market has rewarded it. In general, this portion of the assignment should be an in-depth analysis of the financial status of the firm(s) being considered.
2. How strong is it relative to its competition? Are its competitors more or less profitable over time? How has the market valued them?
You dont need to be long-winded or a financial analyst to do this, but you should include actual numbers. You may find that EBITDA is a good financial measure. Whatever you find, be it from the case or outside research, put into useful charts or tables and place in the exhibits section. State your conclusions in the report itself and reference the specific exhibit when you do. The key is to support your conclusions. I cannot stress this point enough. Please do not throw a bunch of numbers on the paper for the sake of doing so. Everything you include must lead to a point, otherwise do not include it. For example, if you provide liquidity ratios as part of your exhibits, it is not sufficient to say that, say, the quick ratio was 2. In itself, this number means nothing to me. If you are trying to make the case of liquidity (whether in favor or against Apple), then you should use this ratio longitudinally (i.e., over time), or cross-sectionally (i.e., comparing it to Apples competitors), in order to draw meaningful conclusions. Hopefully, this will help you to think about what information is truly relevant and which does not support your logic.
Generally, the analysis section should identify the resources and capabilities which the firm can leverage within its marketplace in order to remain successful in the future. A complete firm-level study will contain three main parts:
1. The external analysis of the firm, which describes the context in which the firm must compete. A thorough external analysis will first address the general environment described in class (see the lecture noteslegal, economic, etc.). Second, look at the industry dynamics and competitive market (e.g. who is the firm selling to, what challenges does the firm face in profitably reaching their customers). Next, the analysis should discuss the firms competitorsare they larger, smaller, more profitable, more flexible? What advantage or disadvantage would these competitors have in the marketplace? The 5-forces model is a good tool to organize your work when defining the competitive environment. While not perfect, it will ensure that you have covered the main points. It is better if you do not mention the term 5 forces diagram in the texthow you display the information is up to you and the needs of your audience (i.e. a manager may never have heard of the 5 Forces)but do show a diagram as an exhibit.
2. The internal analysis of the firm describes the strengths and weaknesses the firm brings to its competitive environment. What resources or capabilities can a firm leverage against its competitors and/or to tap new markets? What weaknesses we might see that will handicap the firm in the future? What are the key strategies the firm is pursuing? Explain whether the strategies are good or bad, and provide support for your arguments. A good internal analysis will show the difference between core competencies and their results. As an example, cost leadership can be the result of engineering capabilities. While sometimes difficult to use, the VRIO analysis is another good analytical tool which can help you to organize your thoughts and develop a supporting argument for why a resource or capability yields a competitive advantage. Having analyzed the firm, you should have an idea of what strengths the firm should be leveraging on and you can look again at the external environment to see what opportunities it should pursue. In many of the cases, the firm in question is contemplating, or has implemented, several specific strategic actions (e.g., an acquisition). In this situation, the written case analysis should also include an evaluation of these specific strategic actions and, where appropriate, recommendations should be made and justified.
3. The recommended strategy should occupy the last quarter to one-third of your analysis. Ideally, you would give one to three alternatives, possibly listed in bulleted form. One option could actually include dont change anything, but very likely this will not be the best choice, especially in a competitive market. Select one of these alternatives as the preferred recommendation. While all three might be good, a firm may only be able to attack one at a time, and will want to know which one you think has the biggest return. Explain why you believe this is the best option for the firm. The alternatives need to be specific action itemssomething that if it were developed into a plan, you could go to a bank and get financing. As an example, instead of saying Firm Z should acquire other companies, try to suggest possible candidatesand say why Firm Z would benefit. If you cant find specific firms, you could say, acquire firms in the range of $XX revenue, or $YY market capitalization, or some other relevant factor. Instead of saying form an alliance, you could recommend form an R&D alliance with Q to leverage this firms superior product rollout capabilities against Qs more advanced technology. It may take some effort, but this will show that you understand a) what makes the firm strong or weak and b) how it can take advantage of those factors. You could even recommend a firm liquidatebe specific and say how management should sell it off.
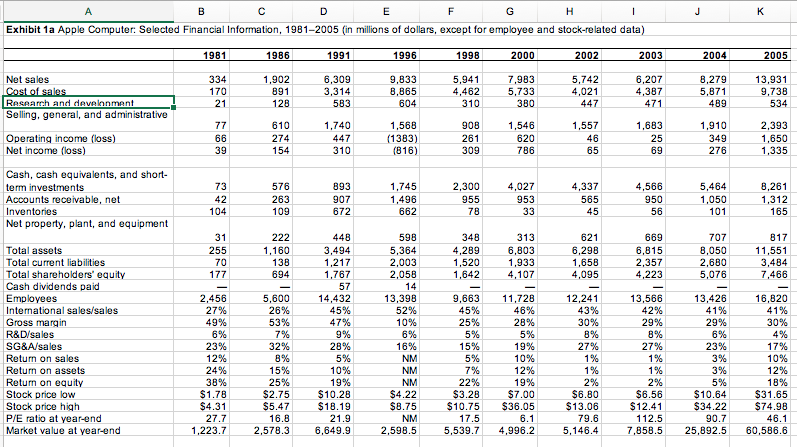
Exhibit 1a Apple Computer: Selected Financial Information, 1981-2005 (in millions of dollars, except for employee and stock-related data) 004 1,902 6,309 7,983 5,733 8,279 5,871 13,931 9,738 Net sales 9,833 8,865 5,742 4,021 6,207 4,387 4,462 10 RAsAArrh and davelnnman Selling, general, and administrative 1,568 1383) 1,546 620 786 1,740 1,557 1,683 2,393 274 Operating income (loss) Net income (loss) Cash, cash equivalents, and short term investments Accounts receivable, net Inventories Net property, plant, and equipment ,745 1,496 5,464 1,050 8,261 576 263 893 4,566 950 2,300 4,027 953 4,337 669 598 5,364 2,003 2,058 621 6,298 1,658 4,095 4,289 1,520 Total assets Total current liabilities Total shareholders' equity Cash dividends paid Employees International salesisales Gross margin R&Disales SG&A/sales Retum on sales Retum on assets Return on equity Stock price low Stock price high P/E ratio at year-end Market value at yearend 6,803 1,933 8,050 2,680 767 7,466 14,432 45% 11,728 46% 5,600 13,398 13,566 42% 2,456 9,663 13,426 16,820 43% 49% 32% 27% 27% 22% $8.75 10.75 $36.05 1,223.7 2,578.3 6,649.9 2,598.55,539.7 4,96.5,146.4 7,858.525,892.5 60,586.6 Exhibit 1a Apple Computer: Selected Financial Information, 1981-2005 (in millions of dollars, except for employee and stock-related data) 004 1,902 6,309 7,983 5,733 8,279 5,871 13,931 9,738 Net sales 9,833 8,865 5,742 4,021 6,207 4,387 4,462 10 RAsAArrh and davelnnman Selling, general, and administrative 1,568 1383) 1,546 620 786 1,740 1,557 1,683 2,393 274 Operating income (loss) Net income (loss) Cash, cash equivalents, and short term investments Accounts receivable, net Inventories Net property, plant, and equipment ,745 1,496 5,464 1,050 8,261 576 263 893 4,566 950 2,300 4,027 953 4,337 669 598 5,364 2,003 2,058 621 6,298 1,658 4,095 4,289 1,520 Total assets Total current liabilities Total shareholders' equity Cash dividends paid Employees International salesisales Gross margin R&Disales SG&A/sales Retum on sales Retum on assets Return on equity Stock price low Stock price high P/E ratio at year-end Market value at yearend 6,803 1,933 8,050 2,680 767 7,466 14,432 45% 11,728 46% 5,600 13,398 13,566 42% 2,456 9,663 13,426 16,820 43% 49% 32% 27% 27% 22% $8.75 10.75 $36.05 1,223.7 2,578.3 6,649.9 2,598.55,539.7 4,96.5,146.4 7,858.525,892.5 60,586.6
Step by Step Solution
There are 3 Steps involved in it

Get step-by-step solutions from verified subject matter experts