

Question: I MATH205 - Chapt.. W 1.2 Homework - O. W 13 Homework - On W 2.1 Homework - O... W 2.2 Hon B. [-/3.54 Points]
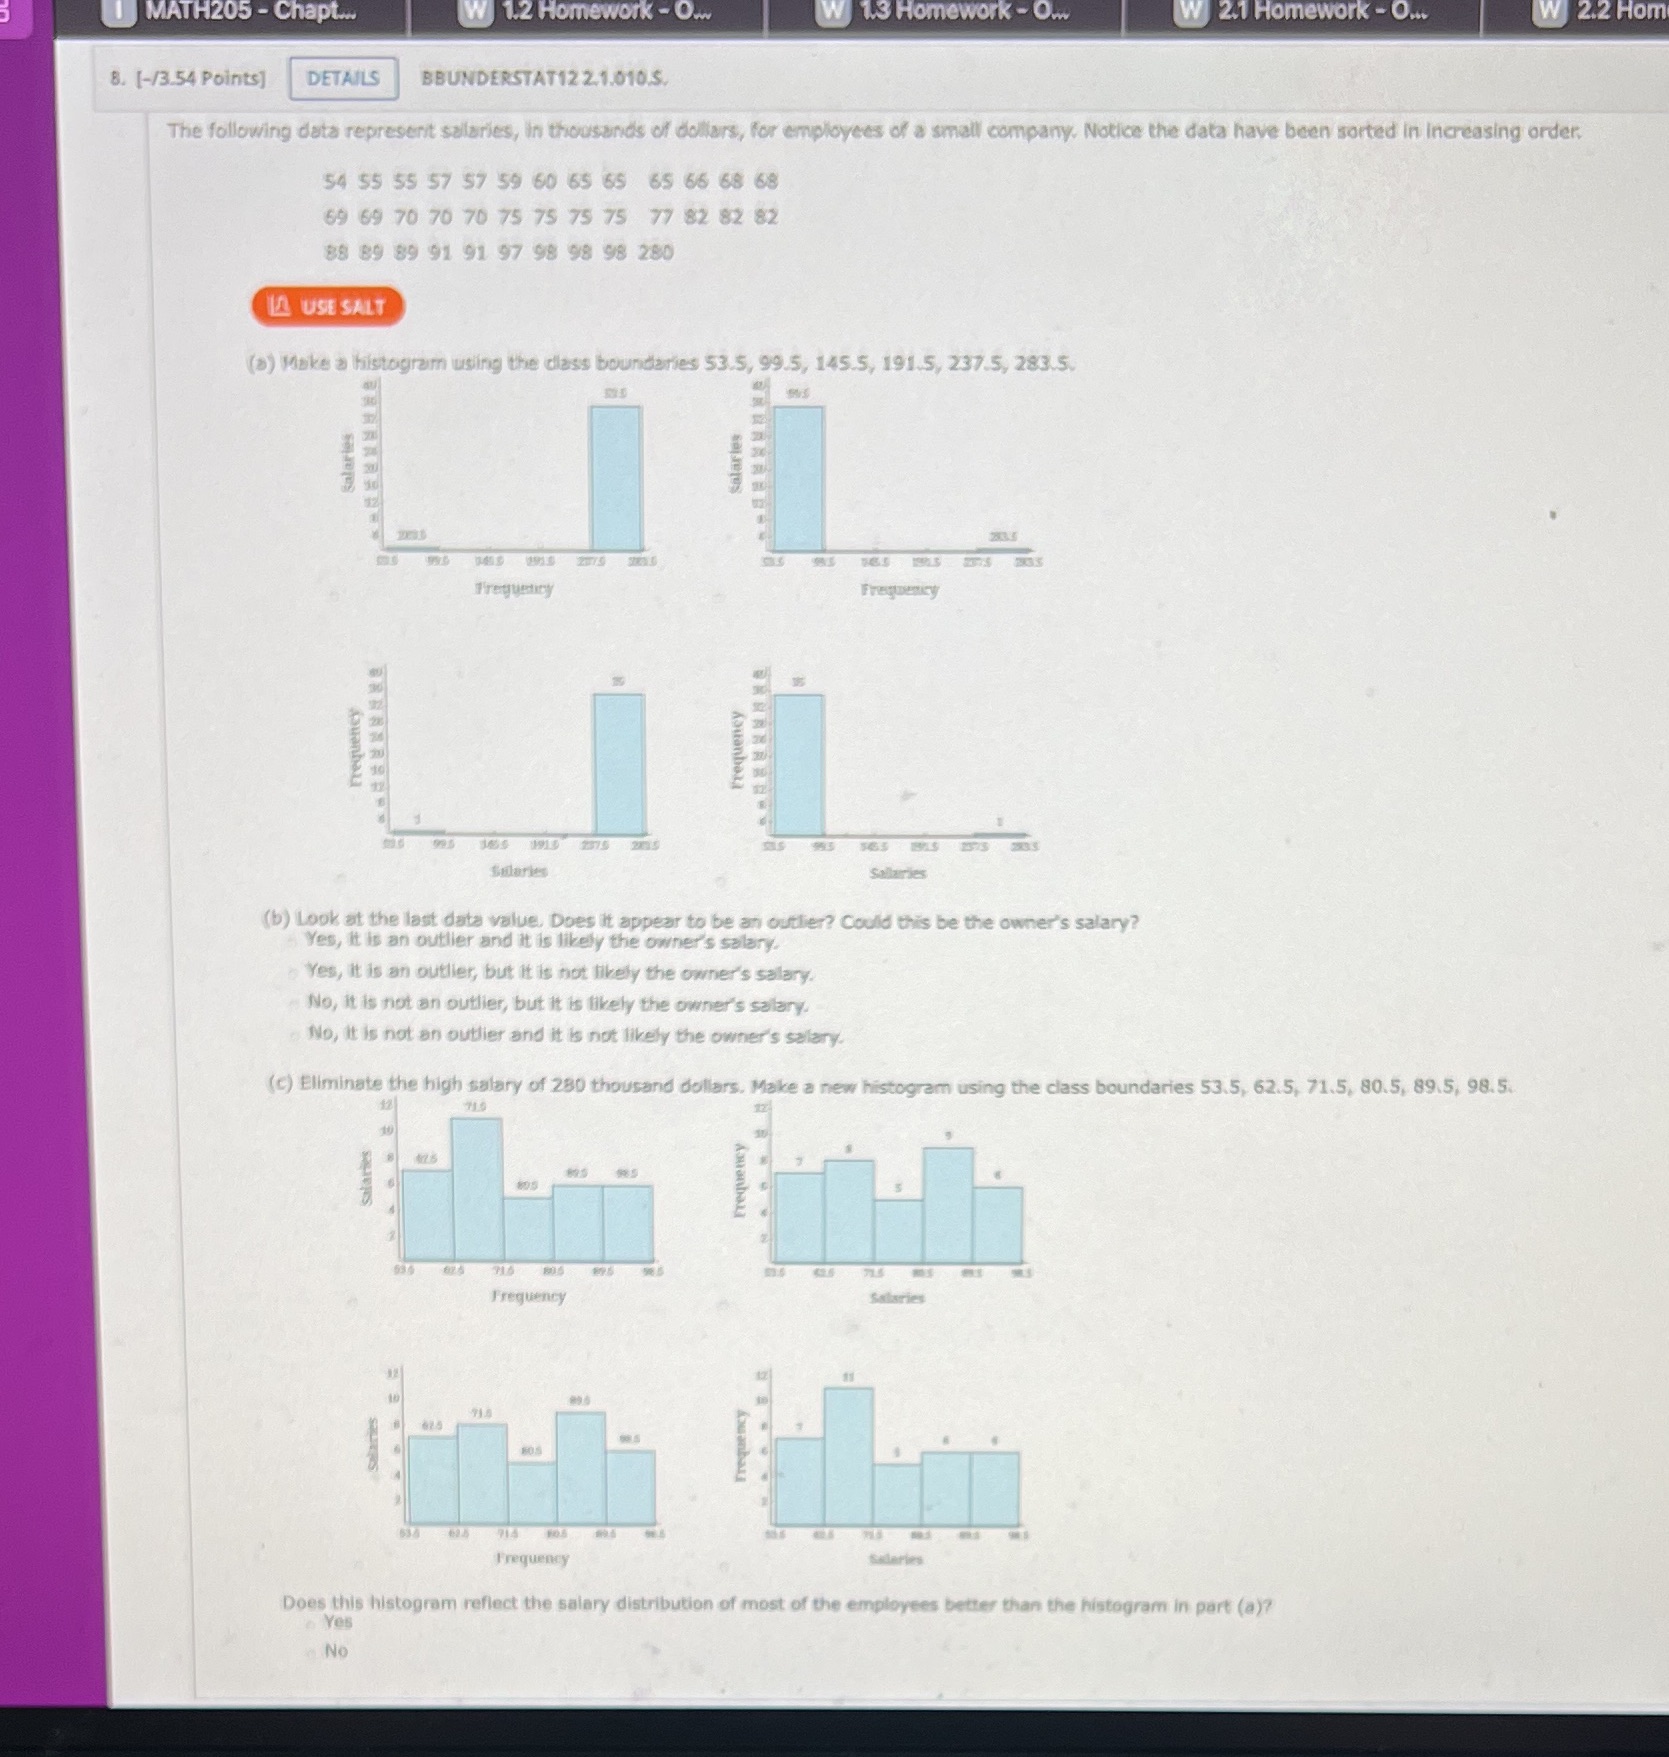
I MATH205 - Chapt.. W 1.2 Homework - O. W 13 Homework - On W 2.1 Homework - O... W 2.2 Hon B. [-/3.54 Points] DETAILS BBUNDERSTAT12 2.1.010.S. The following data represent salaries, in thousands of dollars, for employees of a small company. Notice the data have been sorted in increasing order, 54 55 55 57 57 59 60 65 65 65 65 68 68 69 69 70 70 70 75 75 75 75 77 82 82 82 88 89 89 91 91 97 98 98 98 280 LA USE SALT (a) Make a histogram using the class boundaries 53.5, 99.5, 145.5, 191.5, 237.5, 283.5. Salaries Salarie Frequetity Frequency Frequency 185 1910 Salaries Salaries (b) Look at the last data value. Does it appear to be an outlier? Could this be the owner's salary? Yes, it is an outlier and it is likely the owner's salary. Yes, it is an outlier, but it is not likely the owner's salary. No, it is not an outlier, but it is likely the owner's salary. No, it is not an outlier and it is not likely the owner's salary. (c) Eliminate the high salary of 280 thousand dollars. Make a new histogram using the class boundaries 53.5, 62.5, 71.5, 80.5, 89.5, 98.5. salaries Frequency Frequency 624 Frequency Does this histogram reflect the salary distribution of most of the employees better than the histogram in part (a)? Yes No
Step by Step Solution
There are 3 Steps involved in it

Get step-by-step solutions from verified subject matter experts