Question: i MPG Data The accompanying data represent the miles per gallon of a random sample of cars with a three-cylinder, 1.0 liter engine. (a) Compute
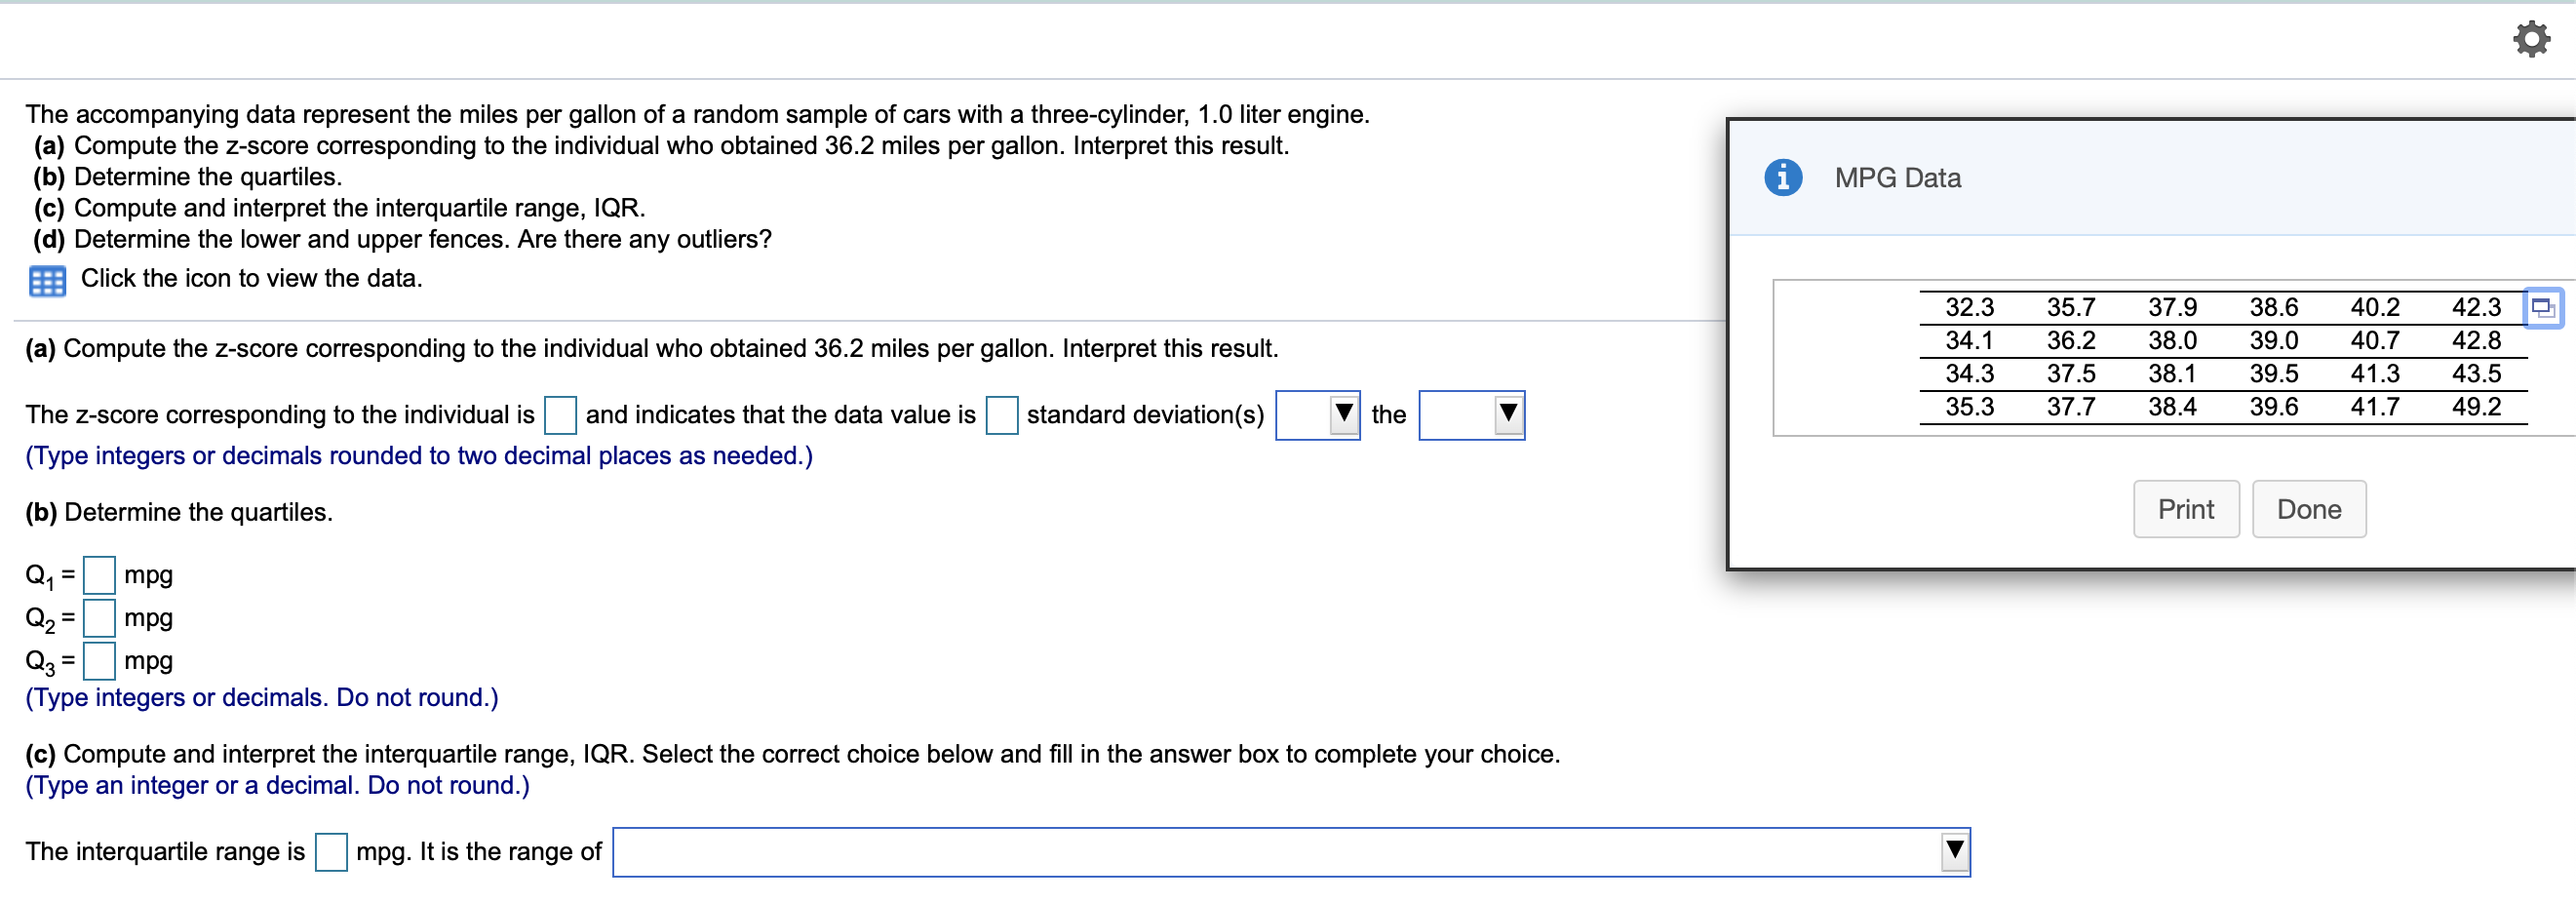
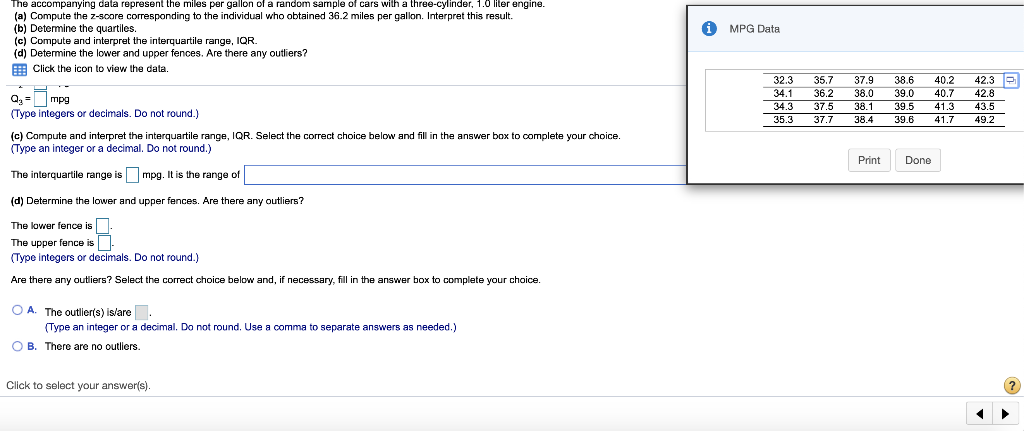
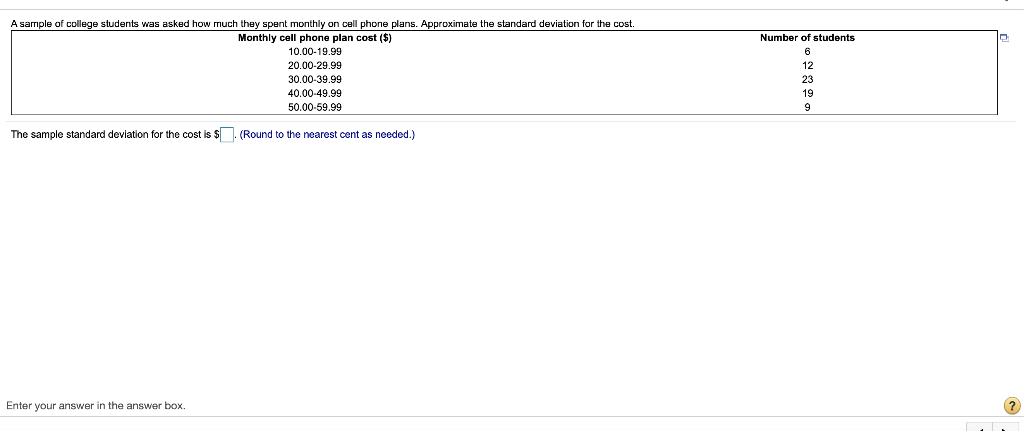
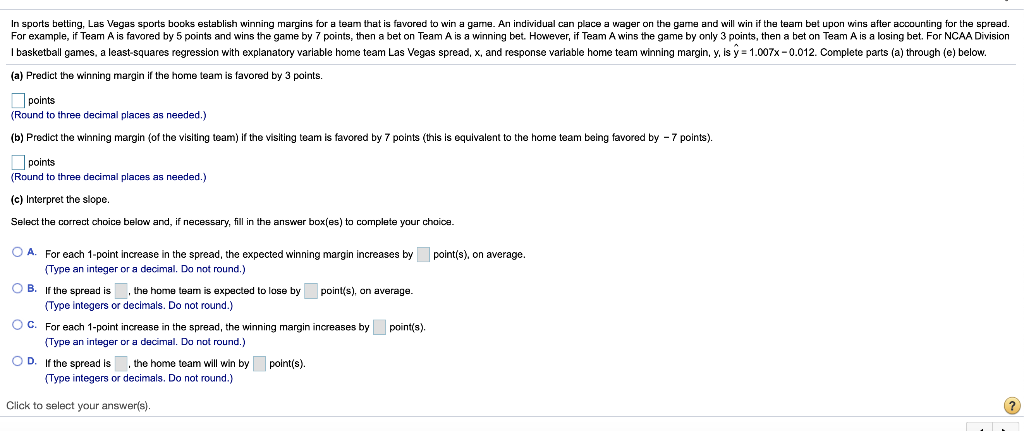
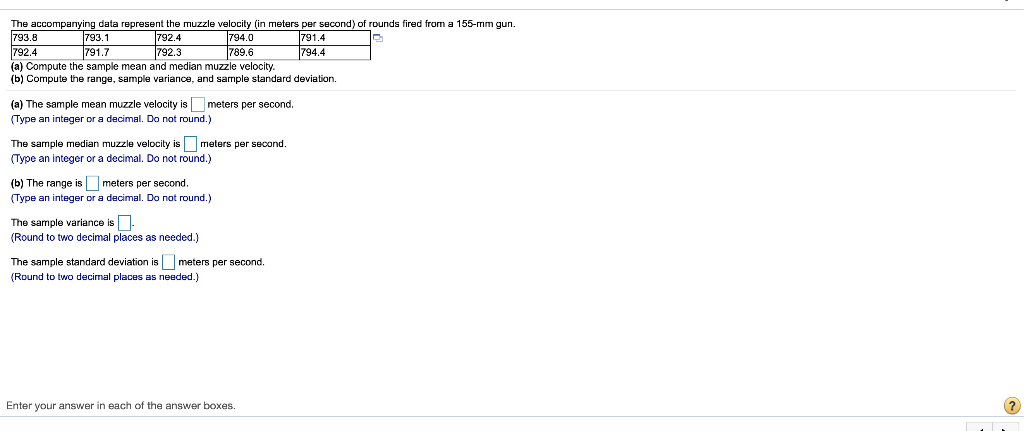
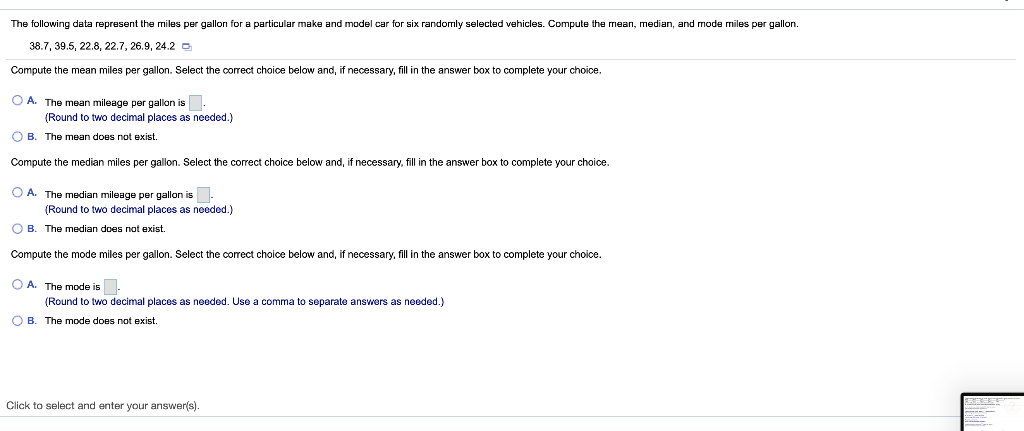
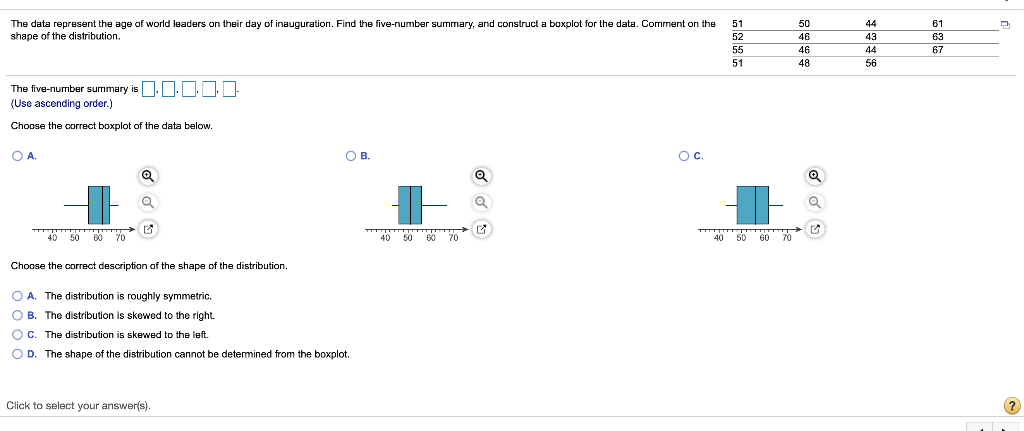
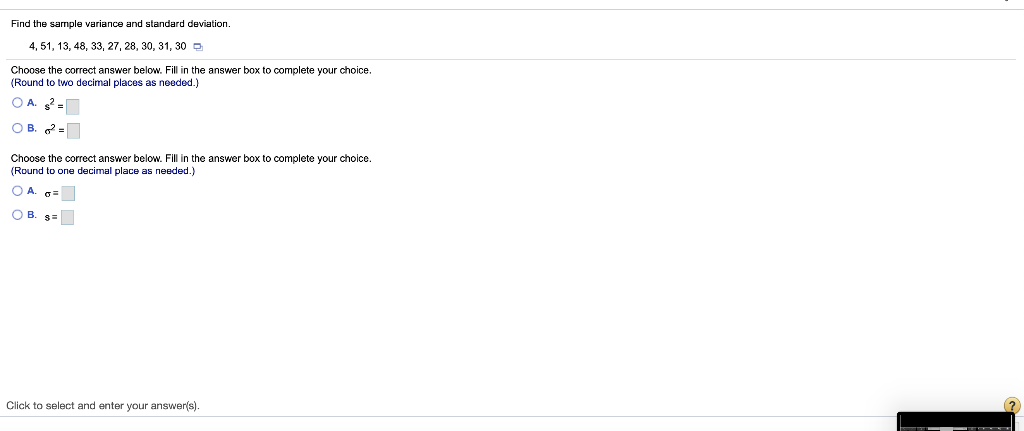
i MPG Data The accompanying data represent the miles per gallon of a random sample of cars with a three-cylinder, 1.0 liter engine. (a) Compute the z-score corresponding to the individual who obtained 36.2 miles per gallon. Interpret this result. (b) Determine the quartiles. (c) Compute and interpret the interquartile range, IQR. (d) Determine the lower and upper fences. Are there any outliers? Click the icon to view the data. (a) Compute the z-score corresponding to the individual who obtained 36.2 miles per gallon. Interpret this result. 32.3 34.1 34.3 35.3 35.7 36.2 37.5 37.7 37.9 38.0 38.1 38.4 38.6 39.0 39.5 39.6 40.2 40.7 41.3 41.7 42.3 42.8 43.5 49.2 standard deviation(s) the The Z-score corresponding to the individual is and indicates that the data value is (Type integers or decimals rounded to two decimal places as needed.) (b) Determine the quartiles. Print Done = Q1 mpg Q2 = mpg Q2 = mpg (Type integers or decimals. Do not round.) (c) Compute and interpret the interquartile range, IQR. Select the correct choice below and fill in the answer box to complete your choice. (Type an integer or a decimal. Do not round.) The interquartile range is mpg. It is the range of MPG Data The accompanying data represent the miles per gallon of a random sample of cars with a three-cylinder, 1.0 liter engine. (a) Compute the z-score corresponding to the individual who obtained 36.2 miles per gallon. Interpret this result. (b) Determine the quartiles. (c) Compute and interpret the interquartile range, IQR. (d) Determine the lower and upper fences. Are there any outliers? Click the icon to view the data. Q, P. | mpg (Type integers or decimals. Do not round.) (c) Compute and interpret the interquartile range, IQR. Select the correct choice below and fill in the answer box to complete your choice. (Type an integer or a decimal. Do not round.) 32.3 34.1 34.3 35.3 35.7 36.2 37.5 37.7 37.9 38.0 38.1 38.4 38.6 390 39.5 39.6 40.2 40.7 41.3 41.7 42.3 42.8 43.5 49.2 Print Done The interquartile range is mpg. It is the range of (d) Determine the lower and upper fences. Are there any outliers? The lower fence is The upper fence is (Type Integers or decimals. Do not round.) Are there any outliers? Select the correct choice below and, if necessary, fill in the answer box to complete your choice. A. The outlier(s) is/are (Type an integer or a decimal. Do not round. Use a comma to separate answers as needed.) OB. There are no outllers. Click to select your answer(s). ? A sample of college students was asked how much they spent monthly on cell phone plans. Approximate the standard deviation for the cost. Monthly cell phone plan cost ($) 10.00-19.99 20.00-29.99 30.00-39.99 40.00.49.99 50.00 59.99 Number of students 6 12 23 19 9 The sample standard deviation for the cost is $(Round to the nearest cent as needed.) Enter your answer in the answer box 2 In sports betting, Las Vegas sports books establish winning margins for a team that is favored to win a game. An individual can place a wager on the game and will win if the team bet upon wins after accounting for the spread. For example, if Team A is favored by 5 points and wins the game by 7 points, then a beton Team A is a winning bet. However, if Team A wins the game by only 3 points, then a bet on Team A is a losing bet. For NCAA Division I basketball games, a least-squares regression with explanatory variable home team Las Vegas spread, x, and response variable home team winning margin, y, is y = 1.007x -0.012. Complete parts (a) through (e) below. (a) Predict the winning margin if the home team is favored by 3 points. points (Round to three decimal places as needed.) (b) Predict the winning margin (of the visiting team) if the visiting team i favored by 7 points (this is equivalent to the home team being favored by - 7 points). points (Round to three decimal places as needed.) (c) Interpret the slope. Select the correct choice below and, if necessary, fill in the answer box(es) to complete your choice. point(s), on average. O A. For each 1-point increase in the spread, the expected winning margin increases by (Type an integer or a decimal. Do not round.) OB. If the spread is the home team is expected to lose by point(s), on average. (Type Integers or decimals. Do not round.) OC. For each 1-point increase in the spread, the winning margin increases by point(s); (Type an integer or a decimal. Do not round.) OD. If the spread is the home team will win by points) (Type integers or decimals. Do not round.) Click to select your answer(s). 2 The accompanying data represent the muzzle velocity (in meters per second) of rounds fired from a 155-mm gun. 793.8 793.1 792.4 794.0 1791.4 1792.4 791.7 1792.3 789.6 1794.4 (a) Compute the sample mean and median muzzle velocity. (b) Compute the range, sample variance, and sample standard deviation, (a) The sample mean muzzle velocity is meters per second. (Type an integer or a decimal. Do not round.) The sample median muzzle velocity is meters per second (Type an integer or a decimal. Do not round.) (b) The range ismeters per second, (Type an integer or a decimal. Do not round, The sample variance is (Round to two decimal places as needed.) The sample standard deviation is meters per second, (Round to two decimal places as needed.) Enter your answer in each of the answer boxes. 2 The following data represent the miles per gallon for a particular make and model car for six randomly selected vehicles. Compute the mean, median, and mode miles per gallon. 38.7, 39.5, 22.8, 22.7, 26.9, 24.2 Compute the mean miles per gallon. Select the correct choice below and, if necessary, fill in the answer box to complete your choice. O A. The mean mileage per gallon is. (Round to two decimal places as needed.) OB. The mean does not exist Compute the median miles per gallon. Select the correct choice below and, if necessary, fill in the answer box to complete your choice. O A. The median mileage per gallon is. (Round to two decimal places as needed.) OB. The median does not exist. Compute the mode miles per gallon. Select the correct choice below and, if necessary, fill in the answer box to complete your choice. O A. The mode is. (Round to two decimal places as needed. Use a comma to separate answers as needed.) OB. The mode does not exist. Click to select and enter your answer(s). 50 61 The data represent the age of world leaders on their day of inauguration. Find the five-number summary, and construct a boxplot for the data. Comment on the shape of the distribution 51 52 55 51 44 43 44 56 67 46 48 The five-number summary is DDDD (Use ascending order.) Choose the correct boxplot of the data below. . . Q Q 40 50 50 60 70 40 50 60 70 40 50 60 70 Choose the correct description of the shape of the distribution O A. The distribution is roughly symmetric. OB. The distribution is skewed to the right. O C. The distribution is skewed to the left. OD. The shape of the distribution cannot be determined from the boxplot. Click to select your answer(s) 2 Find the sample variance and standard deviation. 4,51, 13, 48, 33, 27, 28, 30, 31, 30 Choose the correct answer below. Fill in the answer box to complete your choice. (Round to two decimal places as needed.) OA 2 OB 2 Choose the correct answer below. Fill in the answer box to complete your choice. (Round to one decimal place as needed.) OB Click to select and enter your answer(s). In a certain city, the average 20- to 29-year old man is 69.6 inches tall, with a standard deviation of 3.1 inches, while the average 20- to 29-year old woman is 64.3 inches tall, with a standard deviation of 3.9 inches. Who is relatively taller, a 75-inch man or a 70-inch woman? Find the corresponding Z-scores. Who is relatively taller, a 75-inch man or a 70-inch woman? Select the correct choice below and fill in the answer boxes to complete your choice. (Round to two decimal places as needed.) O A. The Z-score for the woman, is smaller than the Z-score for the man, , so she is relatively taller. OB. The 7-score for the man, is smaller than the z-score for the woman, so he is relatively taller. OC. The z-score for the woman, is larger than the z-score for the man, so she is relatively taller, OD. The Z-score for the man, is larger than the Z-score for the woman, so he is relatively taller. Click to select and enter your answer(s)


