

Question: i need a clear explanation please on how did we get the (red) values in the table below? EXERCISE #9: Given the data on direct
i need a clear explanation please on how did we get the (red) values in the table below? 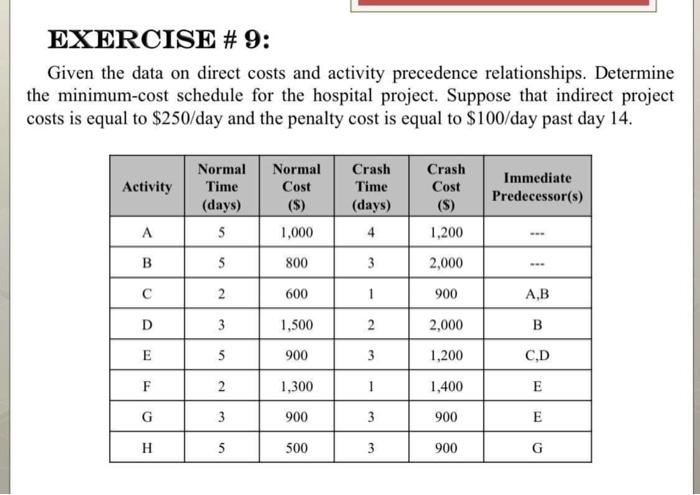
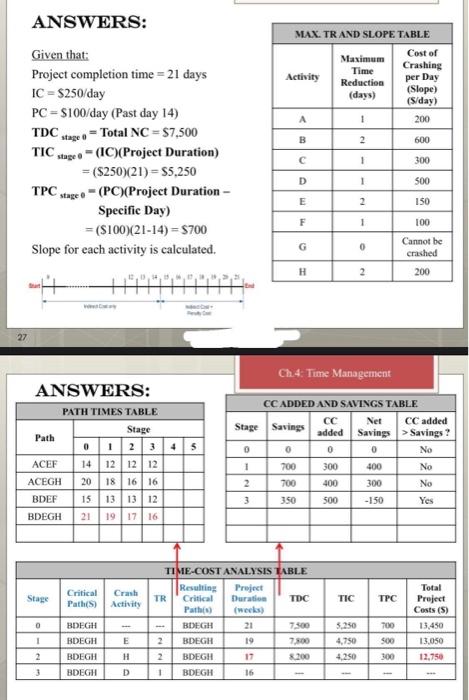
EXERCISE #9: Given the data on direct costs and activity precedence relationships. Determine the minimum-cost schedule for the hospital project. Suppose that indirect project costs is equal to $250/day and the penalty cost is equal to $100/day past day 14. Activity Normal Time (days) Normal Cost (S) Crash Time (days) Crash Cost (S) Immediate Predecessor(s) A 5 1,000 4 1,200 B 5 800 3 2,000 2 600 1 900 A,B D 3 1,500 2 2,000 B E 5 5 900 3 1,200 C.D F 2 1,300 1 1,400 E G 3 900 3 900 E 5 500 3 900 G MAX. TRAND SLOPE TABLE Maximum Cost of Time Crashing Activity Reduction per Day (Slope) (days) (S/day) 1 200 ANSWERS: Given that: Project completion time = 21 days IC - $250/day PC = $100/day (Past day 14) TDC tego - Total NC = $7,500 TIC stuge o - (IC)(Project Duration) = ($250)(21)=55,250 TPC stage = (PC)(Project Duration - Specific Day) =($100)(21-14) = 5700 Slope for each activity is calculated. B 2 600 1 300 D 1 500 E 2 150 F 1 100 G 0 Cannot be crashed H 2 200 ANSWERS: PATH TIMES TABLE Stage Path Ch.4: Time Management CCADDED AND SAVINGS TABLE CC Net CC added Stage Savings added Savings > Savings 0 0 No 1 700 300 400 No 2 700 400 300 No 3 350 500 -150 Yes 0 0 ACEF ACEGH 14 12 12 12 20 18 16 16 15 13 13 12 21 1917 16 BDEF BDEGH Stage Critical Path(s) Crash Activity TIC TPC 0 BDEGH TIME-COST ANALYSIS TABLE Resulting Project TR Critical Duratio TDC Path) (weeks) BDEGH 21 7.500 2 BDEGH 19 7.500 2 BDEGH 17 8200 1 BDEGH 16 1 Total Project Costs (S) 13,450 13.050 12,750 E 5.250 4,750 4.250 700 500 300 BDEGH BDEGH BDEGH 2 H 3 D
Step by Step Solution
There are 3 Steps involved in it
1 Expert Approved Answer
Step: 1 Unlock

Question Has Been Solved by an Expert!
Get step-by-step solutions from verified subject matter experts
Step: 2 Unlock
Step: 3 Unlock