Question: i need a clear explanation please on how did we get all the (red) values in the table below? a step by step calculation please
i need a clear explanation please on how did we get all the (red) values in the table below? a step by step calculation please :)
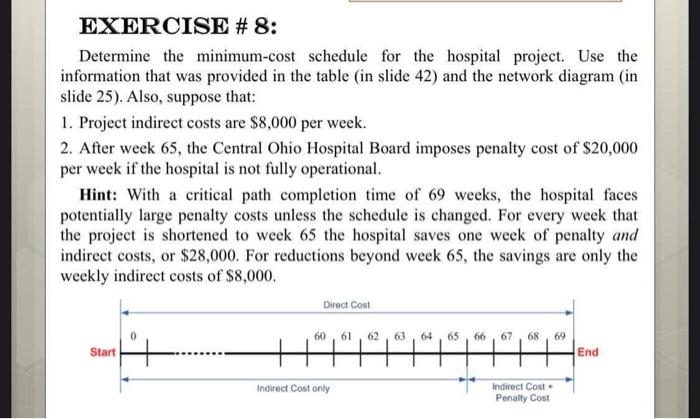
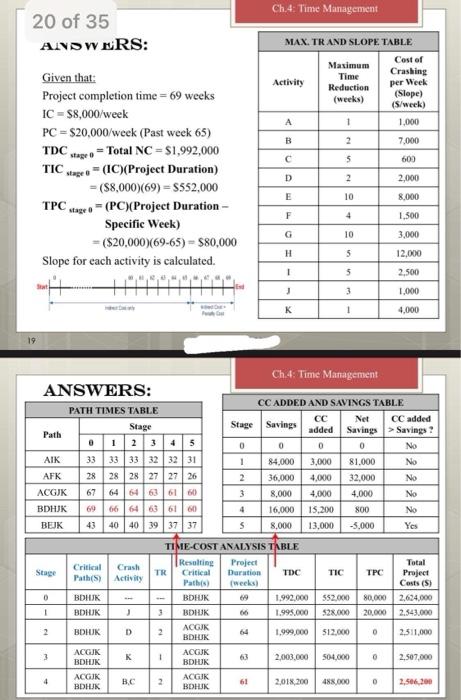
EXERCISE # 8: Determine the minimum-cost schedule for the hospital project. Use the information that was provided in the table (in slide 42) and the network diagram (in slide 25). Also, suppose that: 1. Project indirect costs are $8,000 per week. 2. After week 65, the Central Ohio Hospital Board imposes penalty cost of $20,000 per week if the hospital is not fully operational. Hint: With a critical path completion time of 69 weeks, the hospital faces potentially large penalty costs unless the schedule is changed. For every week that the project is shortened to week 65 the hospital saves one week of penalty and indirect costs, or $28,000. For reductions beyond week 65, the savings are only the weekly indirect costs of $8,000. Direct Cost 60, 61, 62, 63, 64 65 66, 67, 68, 69 Start End Indirect Cost only Indirect Cost Penalty Cost Ch.4: Time Management 20 of 35 ANDWERS: MAX. TRAND SLOPE TABLE Maximum Cost of Time Crashing Activity Reduction per Week (weeks) (Slope) (S/weck) A 1 1,000 B 2 7.000 C 5 600 Given that: Project completion time = 69 weeks IC - $8,000/week PC = $20,000/week (Past week 65) TDC stagoo = Total NC = 51,992,000 TIC tag o- (IC)(Project Duration) = (58,000)(69) = $552,000 TPC ago - (PC (Project Duration - Specific Week) = ($20,000)(69-65) = $80,000 Slope for each activity is calculated. D 2 2,000 E 10 8,000 0 F 4 1.500 G 10 3.000 H 5 12,000 2.500 ! 5 3 1.000 K 1 4,000 19 Net -- Ch.4: Time Management ANSWERS: PATH TIMES TABLE CC ADDED AND SAVINGS TABLE CC CC added Stage Stage Savings Path added Savings > Savings! 0 0 0 0 No AIK 33 33 33 32 32 31 84,000 3,000 81.000 No AFK 28 28 28 27 27 26 36,000 4,000 32,000 No ACGJK 67 164 165 15 8,000 4,000 4.000 No BDHJK 69 66 64 6160 16,000 15,200 800 No BEJK 43 40 40 39 37 37 5 8.000 13,000 -5,000 Yes TIME-COST ANALYSIS TABLE Critical Resulting Project Crash Total Stage TR Critical Duration TIC Path(s) TPC Project Activity Path(s) weeks) Costs (5) D BDHJK BDHUK eve 1.992.000 552.000 80.000 2.634.000 1 BDHIK BDHJK 1.995.000 $28.000 20.000 2.543.000 2 BDHUK D ACGIK 2 64 1.999,000 512.000 . BDHUK 2,511.000 ACGJK ACGJK 63 BDHJK 2.003.000 0 BDHUK 504,000 2.507.000 ACGIK ACGJK 4 BC 2 61 2,018.200 488.000 D BDHIK BDHJK 2,504.00 TMC -1 3 K - 0 EXERCISE # 8: Determine the minimum-cost schedule for the hospital project. Use the information that was provided in the table (in slide 42) and the network diagram (in slide 25). Also, suppose that: 1. Project indirect costs are $8,000 per week. 2. After week 65, the Central Ohio Hospital Board imposes penalty cost of $20,000 per week if the hospital is not fully operational. Hint: With a critical path completion time of 69 weeks, the hospital faces potentially large penalty costs unless the schedule is changed. For every week that the project is shortened to week 65 the hospital saves one week of penalty and indirect costs, or $28,000. For reductions beyond week 65, the savings are only the weekly indirect costs of $8,000. Direct Cost 60, 61, 62, 63, 64 65 66, 67, 68, 69 Start End Indirect Cost only Indirect Cost Penalty Cost Ch.4: Time Management 20 of 35 ANDWERS: MAX. TRAND SLOPE TABLE Maximum Cost of Time Crashing Activity Reduction per Week (weeks) (Slope) (S/weck) A 1 1,000 B 2 7.000 C 5 600 Given that: Project completion time = 69 weeks IC - $8,000/week PC = $20,000/week (Past week 65) TDC stagoo = Total NC = 51,992,000 TIC tag o- (IC)(Project Duration) = (58,000)(69) = $552,000 TPC ago - (PC (Project Duration - Specific Week) = ($20,000)(69-65) = $80,000 Slope for each activity is calculated. D 2 2,000 E 10 8,000 0 F 4 1.500 G 10 3.000 H 5 12,000 2.500 ! 5 3 1.000 K 1 4,000 19 Net -- Ch.4: Time Management ANSWERS: PATH TIMES TABLE CC ADDED AND SAVINGS TABLE CC CC added Stage Stage Savings Path added Savings > Savings! 0 0 0 0 No AIK 33 33 33 32 32 31 84,000 3,000 81.000 No AFK 28 28 28 27 27 26 36,000 4,000 32,000 No ACGJK 67 164 165 15 8,000 4,000 4.000 No BDHJK 69 66 64 6160 16,000 15,200 800 No BEJK 43 40 40 39 37 37 5 8.000 13,000 -5,000 Yes TIME-COST ANALYSIS TABLE Critical Resulting Project Crash Total Stage TR Critical Duration TIC Path(s) TPC Project Activity Path(s) weeks) Costs (5) D BDHJK BDHUK eve 1.992.000 552.000 80.000 2.634.000 1 BDHIK BDHJK 1.995.000 $28.000 20.000 2.543.000 2 BDHUK D ACGIK 2 64 1.999,000 512.000 . BDHUK 2,511.000 ACGJK ACGJK 63 BDHJK 2.003.000 0 BDHUK 504,000 2.507.000 ACGIK ACGJK 4 BC 2 61 2,018.200 488.000 D BDHIK BDHJK 2,504.00 TMC -1 3 K - 0