

Question: I need a drawing for each graph. Figure I Composites Hockey Sticks Hockey Skates Q 1. Assume hockey sticks and ice skates are complements and
I need a drawing for each graph.
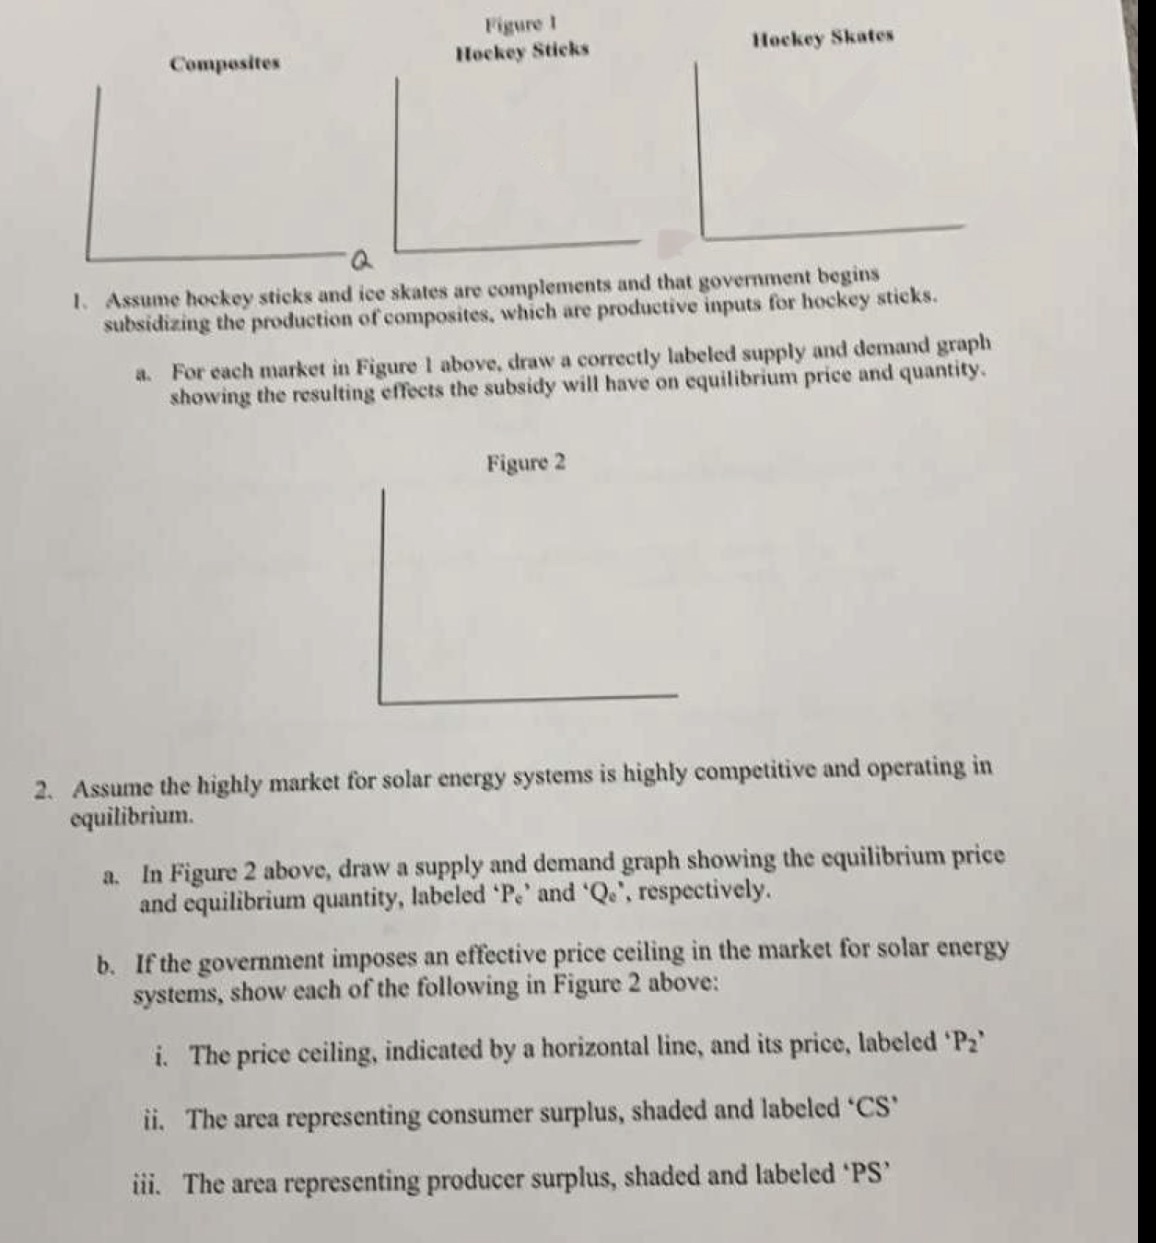
Figure I Composites Hockey Sticks Hockey Skates Q 1. Assume hockey sticks and ice skates are complements and that government begins subsidizing the production of composites, which are productive inputs for hockey sticks. a. For each market in Figure I above, draw a correctly labeled supply and demand graph showing the resulting effects the subsidy will have on equilibrium price and quantity. Figure 2 2. Assume the highly market for solar energy systems is highly competitive and operating in equilibrium. a. In Figure 2 above, draw a supply and demand graph showing the equilibrium price and equilibrium quantity, labeled 'Pe' and 'Q.', respectively. b. If the government imposes an effective price ceiling in the market for solar energy systems, show each of the following in Figure 2 above: i. The price ceiling, indicated by a horizontal line, and its price, labeled 'Pz' ii. The area representing consumer surplus, shaded and labeled 'CS' ii. The area representing producer surplus, shaded and labeled 'PS
Step by Step Solution
There are 3 Steps involved in it

Get step-by-step solutions from verified subject matter experts