Question: i need a graph pls 4. Consider the following function: Y = -0.865 + 8.454X 1.696X2 + 0.132X -0.00331X a. Plot this function on an

i need a graph pls i need a graph pls 4. Consider the following
4. Consider the following function: Y = -0.865 + 8.454X 1.696X2 + 0.132X -0.00331X a. Plot this function on an X-Y graph for positive values of X from 1 to 20. b. How many local maximum solutions are there? c. How many local minimum solutions are there? d. Use Solver to find the maximum value of Y using a starting value of X - 2. What value of Y do you obtain? e. Use Solver to find the maximum value of Y using a starting value of X = 14. What value of Y do you obtain

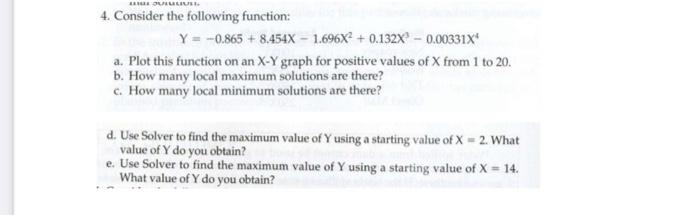
Step by Step Solution

There are 3 Steps involved in it

1 Expert Approved Answer
Step: 1 Unlock blur-text-image
Question Has Been Solved by an Expert!

Get step-by-step solutions from verified subject matter experts

Step: 2 Unlock
Step: 3 Unlock

Students Have Also Explored These Related General Management Questions!