

Question: I need a professional answer for this question Homework: Portfolio 2 Part 2 (chapter 6 & supplement 6) Question 7, Problem 6s.10 Part 1 Problem
I need a professional answer for this question
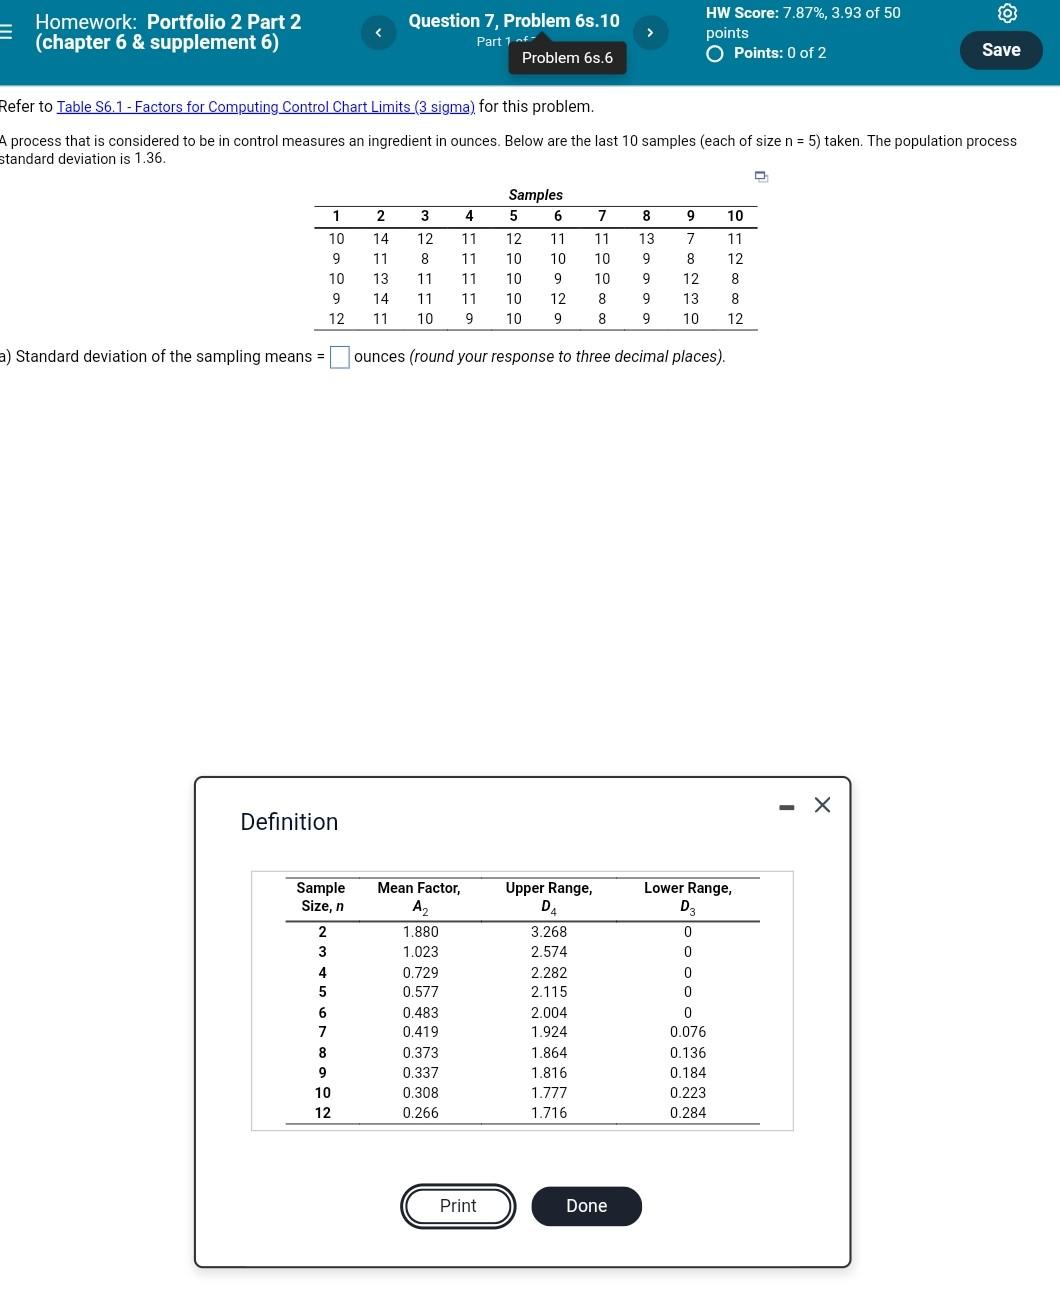
Homework: Portfolio 2 Part 2 (chapter 6 & supplement 6) Question 7, Problem 6s.10 Part 1 Problem 6s.6 HW Score: 7.87%, 3.93 of 50 points O Points: 0 of 2 Save Refer to Table 56.1 - Factors for Computing Control Chart Limits (3 sigma) for this problem. A process that is considered to be in control measures an ingredient in ounces. Below are the last 10 samples (each of size n = 5) taken. The population process standard deviation is 1.36. Samples 5 6 3 4 7 9 8 13 12 11 11 7 8 1 10 9 10 9 12 2 14 11 13 14 11 12 8 11 11 10 11 11 11 11 9 10 11 12 8 10 10 10 10 10 9 12 9 10 10 8 9 9 9 9 12 13 10 8 8 12 a) Standard deviation of the sampling means = ounces (round your response to three decimal places). Definition Sample Size, n Lower Range, D3 0 2 3 0 0 4 5 0 Mean Factor, A2 1.880 1.023 0.729 0.577 0.483 0.419 0.373 0.337 0.308 0.266 Upper Range, DA 3.268 2.574 2.282 2.115 2.004 1.924 1.864 1.816 1.777 1.716 6 7 8 9 10 12 0 0.076 0.136 0.184 0.223 0.284 Print DoneStep by Step Solution
There are 3 Steps involved in it
1 Expert Approved Answer
Step: 1 Unlock

Question Has Been Solved by an Expert!
Get step-by-step solutions from verified subject matter experts
Step: 2 Unlock
Step: 3 Unlock